Update day 2020!

Following more than a decade of tradition (at least), I’ve now updated the model-observation comparison page to include observed data through to the end of 2019.

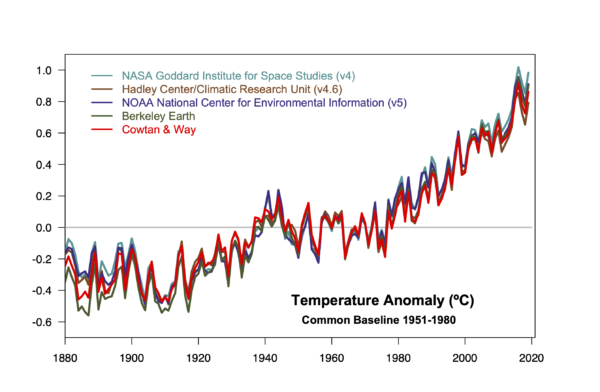
As we discussed a couple of weeks ago, 2019 was the second warmest year in the surface datasets (with the exception of HadCRUT4), and 1st, 2nd or 3rd in satellite datasets (depending on which one). Since this year was slightly above the linear trends up to 2018, it slightly increases the trends up to 2019. There is an increasing difference in trend among the surface datasets because of the polar region treatment. A slightly longer trend period additionally reduces the uncertainty in the linear trend in the climate models.

To summarize, the 1981 prediction from Hansen et al (1981) continues to underpredict the temperature trends due to an underestimate of the transient climate response. The projections in Hansen et al. (1988) bracket the actual changes, with the slight overestimate in scenario B due to the excessive anticipated growth rate of CFCs and CH4 which did not materialize. The CMIP3 simulations continue to be spot on (remarkably), with the trend in the multi-model ensemble mean effectively indistinguishable from the trends in the observations. Note that this doesn’t mean that CMIP3 ensemble means are perfect – far from it. For Arctic trends (incl. sea ice) they grossly underestimated the changes, and overestimated them in the tropics.
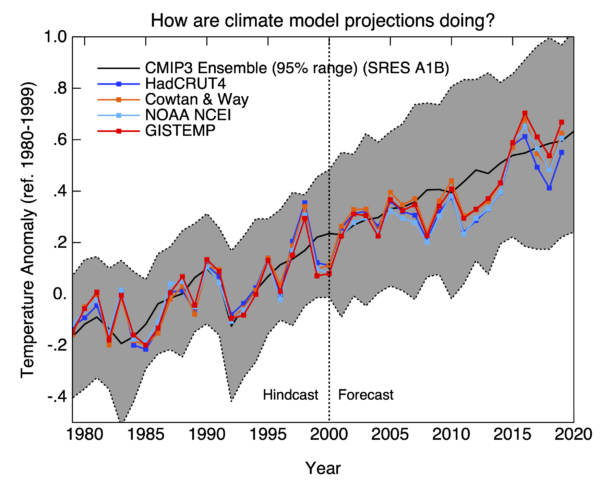
CMIP3 for the win!

The CMIP5 ensemble mean global surface temperature trends slightly overestimate the observed trend, mainly because of a short-term overestimate of solar and volcanic forcings that was built into the design of the simulations around 2009/2010 (see Schmidt et al (2014). This is also apparent in the MSU TMT trends, where the observed trends (which themselves have a large spread) are at the edge of the modeled histogram.

A number of people have remarked over time on the reduction of the spread in the model projections in CMIP5 compared to CMIP3 (by about 20%). This is due to a wider spread in forcings used in CMIP3 – models varied enormously on whether they included aerosol indirect effects, ozone depletion and what kind of land surface forcing they had. In CMIP5, most of these elements had been standardized. This reduced the spread, but at the cost of underestimating the uncertainty in the forcings. In CMIP6, there will be a more controlled exploration of the forcing uncertainty (but given the greater spread of the climate sensitivities, it might be a minor issue).

Over the years, the model-observations comparison page is regularly in the top ten of viewed pages on RealClimate, and so obviously fills a need. And so we’ll continue to keep it updated, and perhaps expand it over time. Please leave suggestions for changes in the comments below.

References


  1. J. Hansen, D. Johnson, A. Lacis, S. Lebedeff, P. Lee, D. Rind, and G. Russell, “Climate Impact of Increasing Atmospheric Carbon Dioxide”, Science, vol. 213, pp. 957-966, 1981. http://dx.doi.org/10.1126/science.213.4511.957


  2. J. Hansen, I. Fung, A. Lacis, D. Rind, S. Lebedeff, R. Ruedy, G. Russell, and P. Stone, “Global climate changes as forecast by Goddard Institute for Space Studies three-dimensional model”, Journal of Geophysical Research, vol. 93, pp. 9341, 1988. http://dx.doi.org/10.1029/JD093iD08p09341


  3. G.A. Schmidt, D.T. Shindell, and K. Tsigaridis, “Reconciling warming trends”, Nature Geoscience, vol. 7, pp. 158-160, 2014. http://dx.doi.org/10.1038/ngeo2105

A Climate Prepper’s Guide To Surviving Extreme Cold and Winter Storms!

Winter kills.  Extreme cold weather is happening more often, and in places that are not used to it, due to the destabilizing effects of climate change. So how do we protect ourselves from the worst that our changing winters can throw our way? Well, here at The Climate Advisor we’ve got you covered. We have compiled the ultimate pile of winter prepping snow balls of bullet-pointed goodness. Over 30 websites from state and federal government, charities, home improvement websites, and bloggers, were reviewed to find the best info about surviving extreme winter weather. Some of the best are linked in this article. We’ll start with a quick look at who is at risk for bad things happening to them, then we’ll go in depth about Read More …

The post A Climate Prepper’s Guide To Surviving Extreme Cold and Winter Storms! appeared first on The Climate Advisor.

Redlining—and Greening—of Cities. What’s the Connection?

The practice of redlining city neighborhoods legally ended in the 1970s. But the negative impacts of nearly four decades of this practice can still be felt today—including when it comes to trees. A new study shows that formerly redlined neighborhoods have far fewer trees than those that were not redlined. People in formerly redlined neighborhoods, therefore,

The post Redlining—and Greening—of Cities. What’s the Connection? appeared first on American Forests.

One more data point

The climate summaries for 2019 are all now out. None of this will be a surprise to anyone who’s been paying attention, but the results are stark.

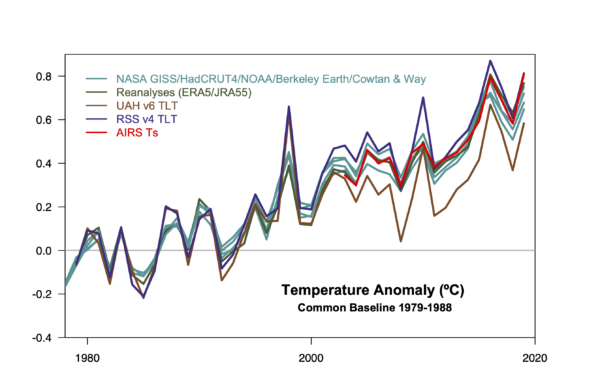
  • 2019 was the second warmest year (in analyses from GISTEMP, NOAA NCEI, ERA5, JRA55, Berkeley Earth and Cowtan & Way, RSS TLT), it was third warmest in the standard HadCRUT4 product and in the UAH TLT. It was the warmest year in the AIRS Ts product.
  • For ocean heat content, it was the warmest year, though in terms of just the sea surface temperature (HadSST3), it was the third warmest.
  • The top 5 years in all series, are the last five years.
  • The decade was the first with temperatures more than 1ºC above the late 19th C in almost all products.

This year there are two new additions to the discussion, notably the ERA5 Reanalyses product (1979-2019) which is independent of the surface weather stations, and the AIRS Ts product (2003-2019) which, again, is totally independent of the surface data. Remarkably, they line up almost exactly.

The two MSU lowermost troposphere products are distinct from the surface record (showing notably more warming in the 1998, 2010 El Niño years – though it wasn’t as clear in 2016), but with similar trends. The biggest outlier is (as usual) the UAH record, indicating that the structural uncertainty in the MSU TLT trends remains significant.

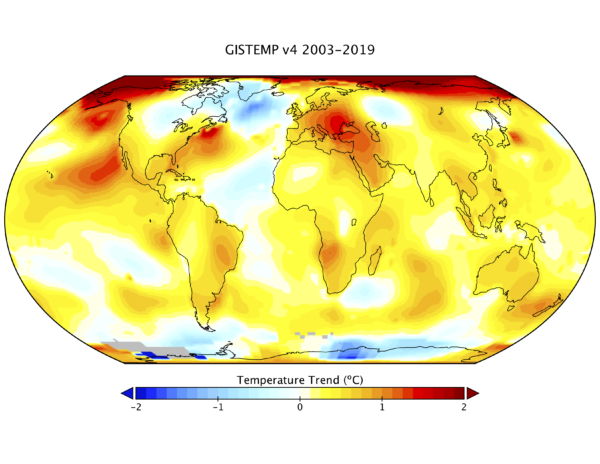
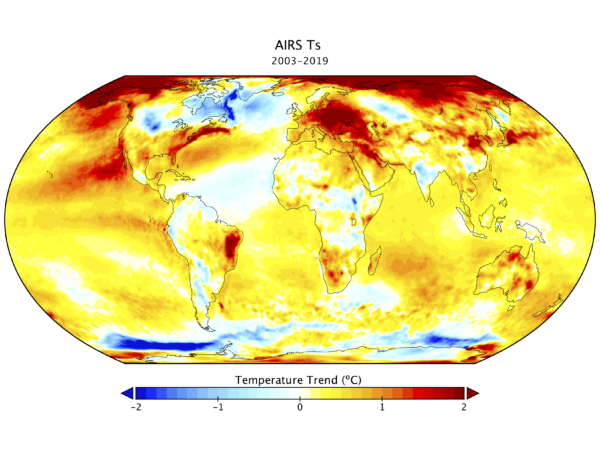
One of the most interesting comparisons this year has been the coherence of the AIRS results which come from an IR sensor on board EOS Aqua and which has been producing surface temperature estimates from 2003 onwards. The rate and patterns of warming of this and GISTEMP for the overlap period are remarkably close, and where they differ, suggest potential issues in the weather station network.

The trends over that period in the global mean are very close (0.24ºC/dec vs. 0.25ºC/dec), with AIRS showing slightly more warming in the Arctic. Interestingly, AIRS 2019 slightly beats 2016 in their ranking.

I will be updating the model/observation comparisons over the next few days.

Matsui, Sarbanes, Fortenberry Lead Bipartisan Effort to Help Homeowners Plant More Trees and Reduce Energy

WASHINGTON, D.C. – On January 15, 2020, Reps. Doris Matsui (D-CA), John Sarbanes (D-MD), and Jeff Fortenberry (R-NE) introduced The Residential Energy and Economic Savings (TREES) Act, a bill to help homeowners lower energy costs, reduce stormwater runoff, and mitigate the effects of climate change by planting more trees. The bill creates a new

The post Matsui, Sarbanes, Fortenberry Lead Bipartisan Effort to Help Homeowners Plant More Trees and Reduce Energy appeared first on American Forests.

Unforced variations: Jan 2020

The new open thread on climate science for a new year, and a new decade – perhaps the Soaring Twenties? What precisely will be soaring is yet to be decided though.

Two things will almost go up – CO2 emissions and temperatures:

But maybe also ambition, determination, and changes that will lead to reduced emissions in future? Fingers crossed.

Bipartisan Legislation Increases Funding for National Forests

 More than One Million Acres will be Reforested by 2030 The Reforestation Act of 2019, introduced December 19, 2019 by Senator Tom Udall (NM), Senator Rob Portman (OH), and Senator Debbie Stabenow (MI) will bring damaged areas in our national forests back to life by providing the U.S. Forest Service with the tools

The post Bipartisan Legislation Increases Funding for National Forests appeared first on American Forests.