By Glenn Ahrens, OSU Forestry and Natural Resources Extension Agent – Clackamas, Marion, & Hood River Counties
As a forester, I need a basic understanding of local climate to guide site-specific decisions –decisions like what species to grow and how many trees per acre to plant. With all the ongoing studies of climate change, I have been looking for practical information relevant to climate and trends affecting forests in Oregon. At an Extension Forestry conference in 2006 in Fairbanks, Alaska, I learned that increased temperatures over recent decades in Alaska had noticeably extended the growing season, melted permafrost, and exacerbated recent forest fires. This stimulated me to learn more about climate science related to my location in Oregon, where I had not really noticed any warming trends amidst the year to year variation in the weather.
How has the climate changed in Oregon? What are anticipated future changes? How might this affect forest management decisions?
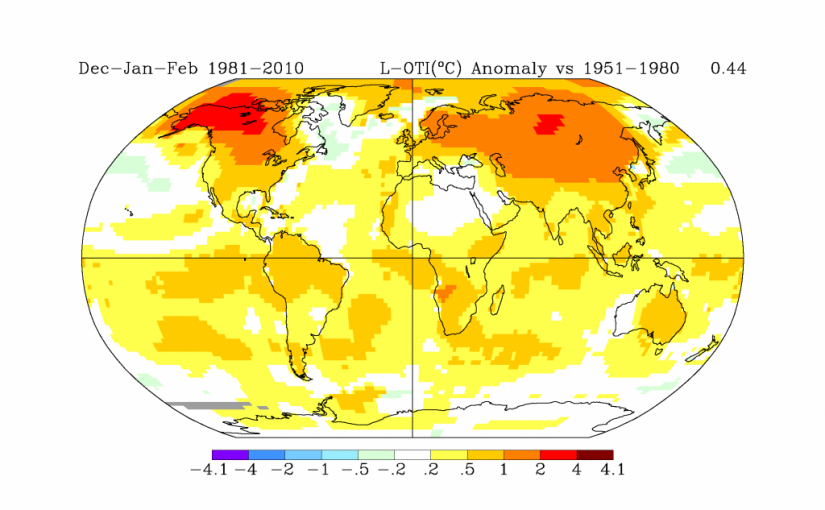
After studying recent temperature records, I found that there has been a slight warming trend in my area of northwest Oregon (~0.5 o F over 30 years, Oregon Climate Service), relatively minor compared to the increases of 4-5 o F at higher latitudes in Canada and Alaska (see map below). Global circulation of ocean and air currents and the position of the jet stream produce very different effects in Oregon vs Alaska. Looking closer at Oregon’s climate, it is easy to see how longer-term trends in temperature change get lost in the far greater year-to-year variability.
Difference in average winter temperatures comparing 1981-2010 vs. the previous 30 years. Warmer winter temperatures over the last 30 years are much more noticeable in Alaska and Canada compared to Oregon. Source: NASA Goddard Institute for Space Studies http://data.giss.nasa.gov/gistemp/maps/
A major driver of climate variability in Oregon is the El Niño/Southern Oscillation (ENSO), a shifting pattern of sea surface temperatures and prevailing winds in the equatorial Pacific Ocean. The warm phase – El Nino – tends to produce warmer, milder winter conditions in Oregon. The cool phase – La Nina – tends to produce cooler, wetter winter conditions. Each phase typically lasts 6 to 18 months. Year to year differences in Oregon temperatures can swing several degrees between El Nino and La Nina (see map below). So far, scientists don’t see any trends or have any predictions on how these are changing.
The shifting ocean temperature pattern from the El Nino Southern Oscillation is a major cause of climate variability in Oregon, causing differences of several degrees between warm phase and cool phase. Source: National Oceanic and Atmospheric Administration (NOAA), National Environmental Satellite, Data, and Information Service (NESDIS), CoastWatch program.
Another source of climate variability in Oregon is the Pacific Decadal Oscillation (PDO) related to shifts in ocean temperature and wind patterns, causing major shifts in temperature on a 20-30 year cycle. The rather dramatic warming in Alaska corresponds closely to a warm phase of the PDO from 1977 to 1998. Pacific climate trends since 1999 suggest we may now be entering a cool phase, but the PDO pattern and any trends are poorly understood.
Once the weather comes in off the ocean or wherever else, the influence of local topography is another puzzle to ponder. Studies of local climate patterns in relation to topography reveal big differences in how regional climate is expressed up on the hill versus down in the valley. For example, in the western Cascades, temperatures in mountain valleys often stay cooler than up on the slopes. Scientists predict that these mountain valleys will also be less affected by overall warming trends in the future. In this case, increases in drought and heat stress due to climate change would be a greater concern on the upper slopes than down in the valley.
Projected temperature increases with climate change are greater on upper slopes compared to valleys in the HJA Andrews Experimental Forest, western Cascade Range of Oregon. Source: Chris Daly, OSU PRISM Climate Group http://cbee.oregonstate.edu/prism
What does this all mean for my trees in the foothills of the western Cascades? Like farmers and foresters everywhere, I have to proceed with management decisions using my best guess on both the short-term weather and the longer-term climate outlook. To inform my best guess, I found it most useful – and interesting – to study local climatology and the factors shaping weather patterns where I live and work. Then, if I start thinking about possible climatic changes, I have an idea of what to watch for in assessing future impacts on my trees.
For instance, recent studies of Swiss Needle Cast (SNC) disease of Douglas-fir, a severe problem in the Oregon Coast Range, show that needle cast thrives with a combination of warm winters followed by moist spring weather during budbreak, the “infection season” in May and June. This happens so often in the coast range that some foresters are planting hemlock instead of Douglas-fir. After seeing what appears to be increasing SNC in the Cascades foothills, I am going to keep track of winter and spring weather trends and needle cast symptoms and see how I feel about needle cast after a few more years.
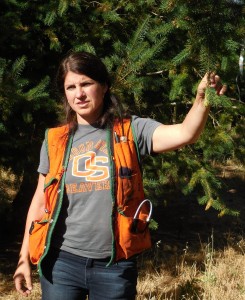
Will spring weather favor Swiss Needle Cast? OSU Extension Forester Glenn Ahrens looks for SNC on Douglas-fir in foothills of west Cascades near Molalla, OR.
By Max Bennett, OSU Forestry & Natural Resources Extension Agent – Jackson & Josephine Counties
The term “climate variability” gets used a lot, but what does it mean? And how does climate variability relate to “climate trends” and “climate change”?
In this article we’ll look at climate variability and trends through the lens of long term snowfall at Crater Lake National Park, as well as precipitation and drought patterns in Medford, Oregon. As a forester working in southern Oregon, I’m very interested in rainfall, drought and snowpack, which influence things like fire danger, forest health, and stream flows.
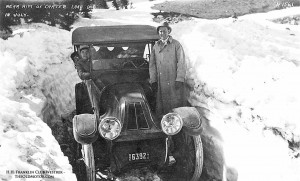
Crater Lake snowpack varies from year to year, but is it declining over time? Left photo: Crater Lake snowpack in July circa 1915. Photo credit: TheOldMotor.com. Right photo: Crater Lake snowpack in January 2015. Photo credit: Klamath Falls Herald Tribune.
The chart below shows annual snowfall at Crater Lake National Park over a 74 year period from 1931-2005. The mean annual snowfall over this time period was 526 inches (44 feet!), but you can see that yearly snowfall amounts varied quite a bit around this average value. And that, in a nutshell, is climate variability: fluctuations around a long term average value.
Note: There were no snowfall data collected during World War II from 1942-42 to 1945-46.
The average isn’t the whole story
While climate averages are interesting, the range of values is just as important. For example, the highest snowfall accumulation during the 1931-2005 period was 835.5 inches (just shy of 70 feet) in the winter of 1951-52, while the lowest value was the measly 243 inches (20 feet) that fell during the 1991-92 winter season. A winter with heavy snowfall means more streamflow while a light year often means higher fire danger and low flows, which is generally a negative for fish, irrigation, and recreation.
Here’s a look at annual precipitation in Medford, Oregon over the last 102 years. As with Crater Lake snowfall, there’s quite a bit of year-to-year variability around the annual average of about 19 inches.
To make it easier to spot short term trends, we can compute a 5-year running average. This is simply the average of the current year’s and previous four years’ values. Looking at the 5-yr average it’s apparent that there was a long-term drought from the teens until WWII, a period from the early 1940s through the late 1970s when rainfall was mostly above average, and another drought in the 1980s. As a side note, bark beetle mortality in SW Oregon really jumped up in the late 80’s with the drought.
These short-term (a few years to a few decades) trends are related to large scale climate patterns such as the Pacific Decadal Oscillation (PDO). The PDO was in the “cool phase” from about 1945 to 1977. This was a period of generally higher precipitation, including snowfall, in the Pacific NW.
What about climate trends?
We see a lot of variability from year to year, and longer term variation associated with cycles like the PDO. As a result, it can be hard to discern long term climate trends.
Let’s look again at the Crater Lake snowfall data – given all of the year to year variability, has there been a long term change in average annual snowfall? The purple line shows a downward trend in snowfall accumulation, which is statistically significant. By contrast, there has been a slight upward trend in Medford’s rainfall over the past century, but it’s not statistically significant.
So we can say with some confidence that over the past 80 years there has been a downward trend in average snowfall at Crater Lake, and no real change in precipitation in Medford. This is consistent with PNW climate records that are showing climate change in the form of long term increases in temperature, reduced snowfall, and no significant changes in average annual precipitation.
A few concluding points:
Climate variability is the fluctuation around a long term average value. Both the average and the range of values, the extremes, are of interest.
Our local climate is highly variable, with substantial year to year fluctuations, as well as longer term variations associated with cycles like the PDO.
Climate change is long term change, that is, an increase or decrease in the average value over many decades.
Future articles in this series will talk about how to manage with climate variability in mind. And they’ll also address another aspect of climate change not discussed here: changes in the range of values, i.e., the extremes.
By Amy Grotta, OSU Forestry & Natural Resources Extension Agent – Columbia, Washington & Yamhill Counties
In this series, our goal is to discuss how woodland owners and managers might want to think about the management decisions we make in light of anticipated climate change. To do that, we need to understand what’s potentially in store. What are the future climate projections for our region, and how do they differ from what we are accustomed to? What is the relationship between climate and weather? That’s what this article aims to address. Future articles will dive into how these changes might affect our forests, and how we can respond.
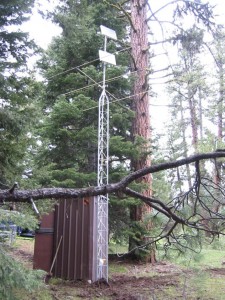
Weather stations like this Snotel station provide long-term climate data for many locations across the landscape. Photo: NRCS Oregon
Let’s start with Oregon’s climate as we know it. This may seem obvious, but it bears summarizing, for comparison to future scenarios. The Oregon Climate Service does a good job describing Oregon’s diverse climate for the uninitiated. Our varied geography is responsible for the climatic diversity we see across the state: how much precipitation falls, and whether it falls as rain or snow; how hot it gets during the day and how cold it gets at night. These patterns show up when we look at long-term weather data for a given site. Because the weather is so varied from year to year, and even from one decade to another, climatologists use observations from a 30-year period to describe average conditions on a site. These are called 30-year normals. The most recent normal data available are from the 30-year period from 1981-2010.
The graphs show 30-year average climate data for two sites in Oregon (Clatskanie and Enterprise). By reducing the year-to-year variation to averages, climate patterns for a site become clear. For example, Enterprise tends to have much wider temperature swings each day than Clatskanie. Typical of western Oregon, Clatskanie gets most of its precipitation in the winter, whereas it is more constant across the year – and much lower overall – in Enterprise. Data like this is available from the Oregon Climate Service for dozens of weather stations across the state, and for different 30-year time periods.
These expected climate patterns guide many of the decisions we make as forest managers, and they have shaped many of the policies and best management practices related to forestry. Some examples:
how far seedlings can safely be moved from their seed source without risk of maladaptation;
what time of year is considered optimal to plant seedlings;
what time of year stream flows are at their lowest, to allow instream work;
what time of year fire season is expected to start and end.
Put simply, the relationship between weather and climate is a matter of scale: weather describes the conditions of the atmosphere over a short period of time, and climate is the expected atmospheric behavior over long periods of time (more here). So climate change is the change in long-term averages of daily weather.
The 2014 National Climate Assessment, produced by a team of hundreds of scientists, summarizes the best available science on past climate and projected climate change in the U.S. Findings are broken down regionally. For the Northwest (Oregon, Washington and Idaho), the NCA tells us:
It’s been gradually getting warmer over the last century, and that trend will continue. Of course, there will continue to be cold years and warm years; but overall, the trend is warmer – anywhere from 3 to 10 degrees warmer, on average, by the end of the 21st century. The largest temperature increases will be felt in the summer.
Precipitation will continue to be highly variable from year to year. That is, any long-term change in annual or seasonal precipitation is not expected to be noticeable. However, due to the warming trend, less of the precipitation will be snow, and more will fall as rain.
Trees along the Willamette Valley margins showed drought stress early in 2015.
The last few years, we’ve experienced weather that is indicative of what the future may look like. For the winter 2014-15, while total precipitation was close to normal, we had record low snowpack and by May all of Oregon was experiencing some level of drought. June 2015 was the warmest June on record in many parts of the state. We can’t attribute a single hot year to climate change; just as we can’t dismiss climate change when the snow piles up (like it did in February 2014; despite the fact that 2014 was Oregon’s warmest year on record). But, where these warm years may have seemed like an exception in the past, in the future they may seem more ordinary.
The next articles in this series will examine some of the nuances in interpreting climate science, and look at how trees and forest ecosystems may respond to these changes.
By Janean Creighton, Oregon State University, Forestry & Natural Resources Extension
Climate change is predicted to accelerate through the 21st century, leading to changes in forest species distribution, productivity, and disturbance regimes¹. These changes may have profound impacts on the public and private benefits from forests; as well as managers’ strategies to sustain these benefits into the future. As our understanding about potential climate change impacts on western U.S. forests improves, land managers are developing adaptation strategies to meet these challenges.
Sara Lipow at Roseburg Forest Products’ seed orchard. Photo: Brad Withrow-Robinson
How do forest managers perceive climate change impacts, and how is this reflected in their forest management strategies? To get a land manager’s perspective, I interviewed Sara Lipow, Forest Geneticist for Roseburg Forest Products.
J.C. Tell me about your background.
S.L. I am the Forest Geneticist for Roseburg Forest Products in charge of tree improvement, and have been since 2008. Before that, I was the geneticist for the state of Oregon, working in ODF’s Private Forests Program, where one my key responsibilities was to assist small woodland owners. I established a seed bank to provide small woodland owners with access to genetically improved seedlings, which are now widely available for purchase through private nurseries. I’m also a small woodland owner myself, with 40 acres in Lane County.
J.C. From the perspective of a geneticist and a small woodland owner are you noticing significant changes in the resource in terms of climate change?
S.L. During the past few years, trees have been developing much earlier in the season; especially this year: trees began flowering and breaking bud several weeks earlier than is typical. Tree phenology—the timing of various developmental stages–is linked to climate. Trees are flexible with respect to phenology and climate, but there are also genetically based adaptations. For example, the timing of bud burst will differ for a Douglas-fir tree from Cascadia and Coos Bay, even if they are grown on the same site and this is genetically controlled; but the timing of both will vary with climatic conditions.
J.C. What other changes are you seeing that are linked to climate?
Douglas-fir dieback, western Oregon. Photo: Brad Withrow-Robinson
S.L. I work primarily with Douglas-fir in western Oregon. There’s a lot of die back of individual branches and tops of trees that’s happening currently, which is drought related and seen primarily on droughty sites. If you drive up and down I-5 right now, you can see browning at the tops of some trees and many dead, individual branches. Trees growing along the highway are often on sites where soil is compacted or conditions are otherwise not ideal for tree growth, which makes the phenomena especially visible along roadsides. It is less prevalent in healthy, appropriately stocked established stands.
J.C. Are you seeing this primarily with Douglas-fir?
S.L. I’m seeing this drought related die-back with a range of species.
J.C. Are there areas that you see as being more vulnerable to changes in environmental conditions? Anything you’re seeing that’s unexpected?
S.L. Swiss needle cast is a native pathogen that affects Douglas-fir, especially along the coast of Oregon, and results in reduced tree growth and needle loss. There are different ideas about how much Swiss needle cast might be expected to change with climate change. We know the timing of when the pathogen’s spores are released – and thus the likelihood it will infect trees – is linked to environmental cues, but we don’t have a complete enough picture of this ecological interaction to make good predictions about how disease severity will change under different climate scenarios.
There has been increasing concern about intensified Swiss needle cast in the Coos Bay area, which may be linked to climatic changes. So for landowners with property in the Swiss needle cast zone or on the edge of this zone, there’s no clear picture whether they will see more or less of this disease. Then there’s fire, of course. Climate impacts will impact fire regimes—something of present concern. Depending on the patterns of climate change, some outcomes could be helpful, while others will be harmful.
J.C. How could climate impacts be helpful?
S.L. Climate models are not yet accurate at the local level. We don’t know whether drought-limited sites will get wetter. It is possible that we could see an increase in productivity in some of our forests, IF droughty sites get wetter at the right time of year. We really don’t have a handle on that; as the precipitation models at a local scale are uncertain. Warmer temperatures also could mean that trees will break bud earlier, have a longer growing season, and potentially grow faster.
J.C. In the forests that you are managing, are you prioritizing specific management areas?
S.L. We are increasingly focused, at a research level, on understanding how different populations of Douglas-fir grow in different environments. Oregon has got a lot of environmental variation linked to geography and as you move from the coast, inland, and into the mountains, the change in environment can be viewed as a surrogate for changes that may occur in climate over time. We are spending a lot of effort understanding the adaptation of trees to their environment so we can make informed decisions on where we plant different sources to ensure that they remain well adapted to current and future climates. In Oregon in the 1970’s, there was an idea of extreme local adaptation, and people developed very small seed zones; for a few decades in the Pacific Northwest most landowners planted very localized seed sources. There has been an increased understanding that this was not biologically based, and that Douglas-fir is much more flexible and widely adapted and can be safely moved longer distances. Genetic research linked to climate and the environment provides a better understanding of the adaptability of populations and how they respond to environmental variation.
The forest industry and most public agencies overwhelmingly plant genetically improved stock when they reforest. Such genetically improved seedlings are available for non-industrial landowners; and are a good choice for landowners that want to guard against future climate impacts. This is because the trees in the tree improvement program—those producing the seed used to grow the genetically improved seedlings–have generally been selected for wide adaptability. They have been shown to perform well across a range of sites. So while there are limited options for what people can do with their existing forests, if landowners are planting a new forest, I would encourage the planting of genetically improved seedlings. These seedlings provide high return on investment. Genetically improved seedlings are available for Douglas-fir and coastal western hemlock.
Douglas-fir seedlings from an Oregon nursery. Photo credit: Oregon Department of Forestry
J.C. What about the drier east side forests?
S.L. Well, for the mixed-conifer stands the safest approach from an adaptability standpoint is to put them back into mixed-conifer stands; but of course you have to weigh this from a landowner value perspective. There are different values for different species.
J.C. So one of the adaptation strategies you see is the planting of genetically improved seedlings. Is that happening all over the region?
S.L. Yes, in western Oregon and Washington the overwhelming number of Douglas-fir seedlings planted on both public and private lands has been tested by tree improvement programs.
J.C. So if a group of landowners were to ask you, “What’s one thing I can do to prepare for climate impacts” it would be to plant the improved seedlings.
S.L. Yes. That would be it. The Oregon Department of Forestry puts out an annual publication: “Sources of Native Forest Nursery Seedlings” for small woodland owners. Landowners can look in this publication to find nurseries growing seedlings adapted to their region, including genetically improved ones.
J.C. In terms of the vulnerabilities to increased pathogens, etc., what’s the strategy?
S.L. Manage for as healthy a stand as possible. Overstocked stands can be more prone to pathogens and drought.
¹References:
Coops, N.C., and R.H. Waring. 2001. Estimating maximum potential site productivity and site water stress of the eastern Siskiyous using 3-PGS. Canadian Journal of Forest Research 31:143-154
Coops, N.C. and R.H. Waring. 2011. Estimating the vulnerability of fifteen tree species under changing climate in Northwest North America. Ecological Modelling 222:2119-2129
Mote, P.W., and E.P. Salathé. 2010. Future climate in the Pacific Northwest. Climatic Change 102(1-2): 29-50, doi: 10.1007/s10584-010-9848-z.
Waring, R.H., N.C. Coops and S.W. Running. 2011. Predicting satellite-derived patterns of large-scale disturbances in forests of the Pacific Northwest Region in response to recent climatic variation. Remote Sensing of Environment 115:3554-3566.