
So Wednesday was temperature series update day. The HadCRUT4, NOAA NCEI and GISTEMP time-series were all updated through to the end of 2018 (slightly delayed by the federal government shutdown). Berkeley Earth and the MSU satellite datasets were updated a couple of weeks ago. And that means that everyone gets to add a single additional annual data point to their model-observation comparison plots!
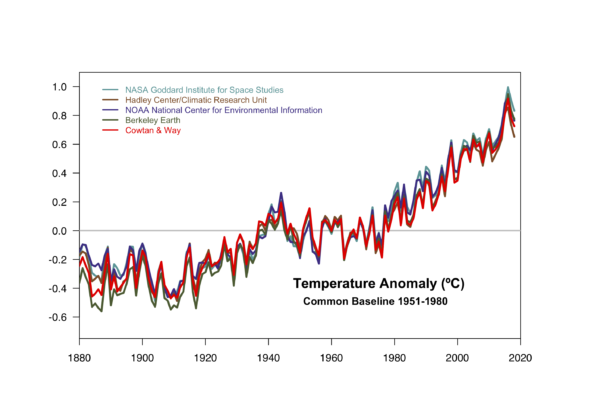
For people who had been paying attention to the data over the last year, the results were not surprising. With the mild La Niña conditions at the beginning of the year, expectations were that 2018 would come in slightly cooler than 2017 (and of course 2016), and so it proved. As in recent years there is a spread in the estimates based on how the Arctic is treated, with the products that don’t extrapolate coming in cooler than those that do, but differences are small.
There were some nice data visualizations out there. From Axios there were some spinning globes of the 40 year trends. The LA Times went with stripes:
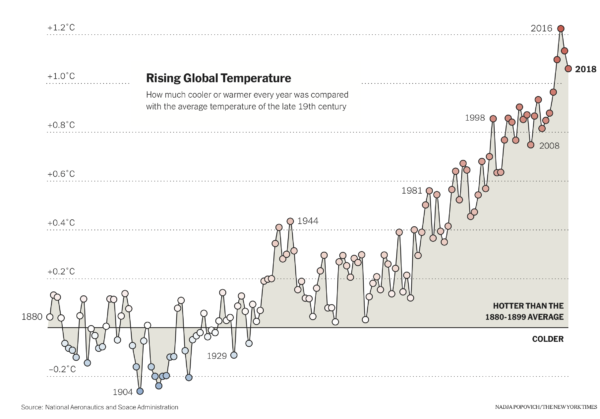
The NY Times had their graphic on the front page, above the fold.
There were also updates to the excellent movies from GSFC SVS and the NASA Earth Observatory:
There were a couple of novelties to the presentations this year. Notably a comparison between trends from the in-situ analyses and remote sensing of ground temperature anomalies from AIRS (which is in press at ERL), and to the just released ERA5. Both of these comparison suggest that that patterns of trends are robust, but that the in situ product may still be underestimating change in the Arctic [but more on that another time].