Last weekend, in Reykjavik the Arctic Circle Assembly was held, the large annual conference on all aspects of the Arctic. A topic of this year was: What’s going on in the North Atlantic? This referred to the conspicuous ‘cold blob’ in the subpolar Atlantic, on which there were lectures and a panel discussion (Reykjavik University had invited me to give one of the talks). Here I want to provide a brief overview of the issues discussed.
What is the ‘cold blob’?
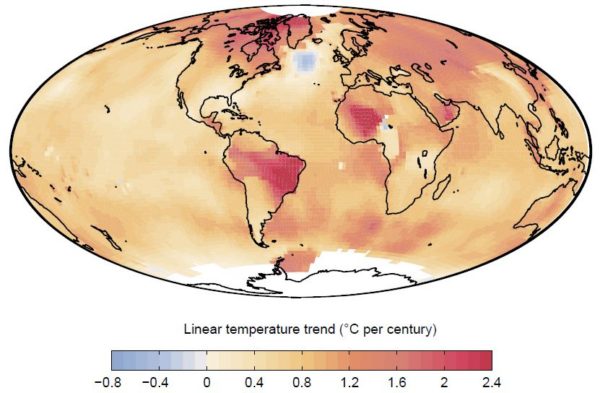
This refers to exceptionally cold water in the subpolar Atlantic south of Greenland. In our paper last year we have shown it like this (see also our RealClimate post about it):

Fig. 1 Linear temperature trends from 1901 to 2013 according to NASA data. Source: Rahmstorf et al, Nature Climate Change 2015.
Sometimes the term ‘cold blob’ is not used for this long-term trend but for a recent snapshot: 2015 was the coldest year in this region since records began in 1880 – despite this being globally the warmest year on record. In the ‘cold blob’ discussion, one must thus keep in mind whether talk is about the long-term trend or a short-term anomaly. When we wrote our paper, of course, we did not know that its publication would then coincide with record cold in the area.
You can see the current ‘cold blob’ when looking at maps of the sea surface temperature for example on Climate Reanalyzer.
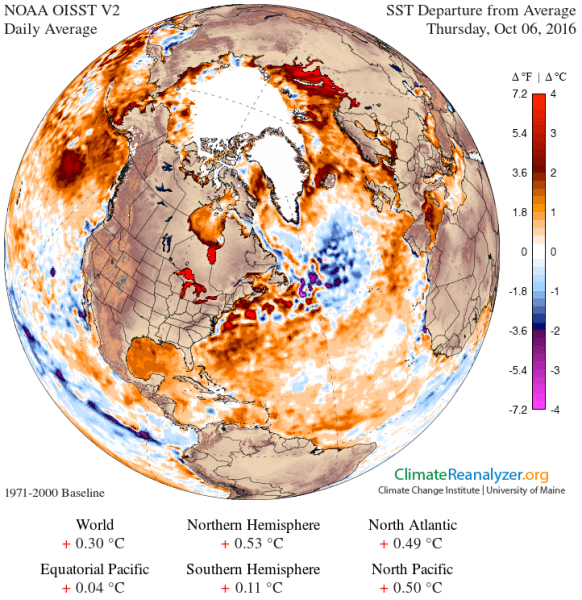
Fig. 2 Anomaly of sea surface temperature (relative to the base period 1971-2000) on 6 October 2016. Source: Climate Reanalyzer
What is the cause of the cold blob?
In principle, there can be two reasons for a change in ocean temperature: heat exchange through the surface or heat transports within the ocean. Halldór Björnsson of the Icelandic weather service showed in his lecture on Saturday that the short-term temperature fluctuations from year to year correlate with the heat exchange through the sea surface, but that this does not explain the longer-term development of the ‘cold blob’ over decades. He concluded that the latter is caused by changes in the North Atlantic ocean circulation, also called the Gulf Stream System. That’s exactly what one expects. Weather dominates the short-term fluctuations, but the ocean currents dominate the long-term development.
One suggestion that had been made some years ago – that the cooling may be caused by shading the sun by aerosol pollution – did not show up in the discussion on Saturday. In the scientific literature that idea was rapidly contradicted at the time, for good reasons (we discussed this in more detail in our paper).
What evidence speaks for a slowdown of the Gulf Stream System?
The basic problem is the lack of direct, continuous measurements of the key circulation in the Atlantic, the so-called AMOC (Atlantic Meridional Overturning Circulation). Such measurements are only available since 2004 through a series of moorings at 26°N (RAPID project). For the longer term development, one must therefore use indirect indicators of the flow.
My colleagues Mihai Dima and Gerrit Lohmann of the Alfred Wegener Institute in Germany in a 2010 study analysed the patterns of changes in global sea surface temperatures. They were the first to conclude that the AMOC has been weakening since the 1930’s. The evidence for this is the trend towards cooling in the subpolar North Atlantic which anti-correlates with temperatures in the South Atlantic (suggesting reduced heat transport from the South Atlantic to the North Atlantic). In addition, Dima and Lohmann found an anti-correlation to the temperatures off the US East Coast, to the south-west of the ‘cold blob’. This is not seen in Fig. 1 above, since the NASA data use a smoothing radius of 1200 km, but you can see it, for example, in the currently high temperatures in Fig. 2.
The latest high resolution simulations of the GFDL in Princeton show precisely this pattern in response to a CO2 increase in the atmosphere (discussed more in this RealClimate post). In the model the cause is a slowdown of the Gulf Stream system. There are also coral data from the Gulf of Maine off the US coast, which indicate a similar time evolution of water mass changes there as the ‘cold blob’ (discussed further in the same post).
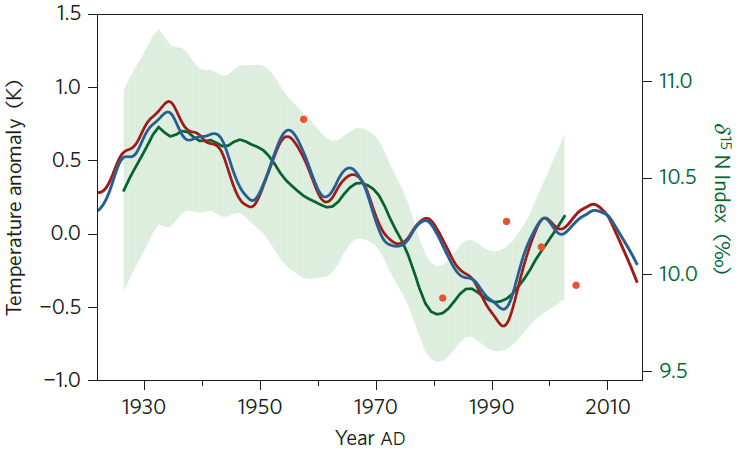
Fig. 3 Index of the strength of the overturning circulation in the Atlantic (AMOC), calculated from the temperature in the subpolar Atlantic minus the mean temperature of the Northern Hemisphere (red and blue curves). The green curve shows the coral data of Sherwood and colleagues. Source: Rahmstorf et al, Nature Climate Change 2015.
For the most recent past, the Atlantic flow index we calculated from the temperature pattern is consistent with other data. For the time since 2004, for which there are direct measurements of the AMOC from the RAPID array, the downward trend by 3 Sv measured there agrees with our indirect estimate. The significant slowdown after 1970 and then following recovery from about 1990 in our curve has been confirmed by other studies with other methods (see e.g. Haine 2016 and its schematic diagram).
What speaks against a slowdown of the Gulf Stream System?
As a counter-argument against a weakening of the Gulf Stream system, Steingrímur Jónsson on Saturday brought up the measurements of the so-called “overflow” from the Nordic Seas across the sills between Greenland, Iceland and Scotland, which do not show any trend. Here one must simply distinguish between different parts of the Atlantic ocean circulation. In our study, we argue that the AMOC in the open Atlantic has weakened – i.e. to the south of the ‘cold blob’, where the heat comes from. This is what’s measured by the RAPID array. The overflows further north are (i) unlikely to have an influence on the temperatures in the ‘cold blob’, and (ii) are largely independent of the AMOC in the open Atlantic – at least that is suggested by a model simulation of the Max Planck Institute for Meteorology in Hamburg, for which we show a correlation analysis in Fig. 2b in our paper.
Another counterargument (though not brought up in professional discourse but on a “climate skeptics” website) is that the measurements on the Oleander line across the Gulf Stream show no slowdown (Rossby et al. 2014). However, these cover only a 20-year period for which our AMOC index also does not show any slowdown. And as Tal Ezer showed in a study in 2015, these measurements of the Gulf Stream don’t correlate with the AMOC measurements of the RAPID array – which is not surprising because the AMOC is only a minor component of the mainly wind-driven Gulf Stream. Therefore these diverse measurements of other aspects of the complex Atlantic ocean circulation are by no means inconsistent with a general long-term slowdown of the AMOC as proposed by Dima and Lohmann.
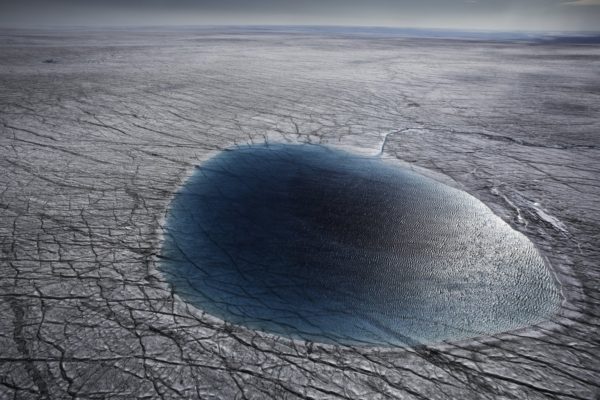
Meltwater lake in Greenland. Photo courtesy of Ragnar Axelsson
What role does the meltwater from Greenland play?
In our paper, we argued that the meltwater input from the Greenland ice sheet could play a so far neglected role (but not the main role, as some have misunderstood). The standard IPCC models, for example, have not yet taken into account this meltwater input. A new study by Claus Böning and colleagues (Nature Geoscience in 2016) has specifically studied the effect of added meltwater in a high-resolution ocean model. It was assumed that starting from 1990, the Greenland ice sheet begins to lose mass – initially starting with a melt rate of zero which is linearly increased until 2020. The authors find little influence on the flow – but this is hardly surprising given the design of this experiment. The real Greenland ice has not started to lose mass only since 1990, it takes time until the meltwater spreads and accumulates, and also the ocean circulation will react with delay and inertia. The prescribed cumulative meltwater amount in the model experiment is 7,500 cubic kilometers in the period 1990-2020, over half of which is added over the last ten years, so the AMOC has little time to react. In our paper, based on data from Jason Box from the Geologic Survey of Denmark and Greenland, we estimated that the Greenland ice sheet has already come out of equilibrium since the beginning of the 20th century and has since added about 13,000 cubic kilometers of meltwater to the ocean. The response of the AMOC could therefore be greater than in the model experiment.
In a further experiment, Böning and co-workers showed that a cumulative freshwater volume of ~20,000 cubic kilometers leads to a breakdown of deep convection and a slowdown of the AMOC by 5 Sv within a few years. The main conclusion of their study is not that Greenland melt has no influence on the AMOC, but as the title of the paper says it shows “Emerging impact of Greenland meltwater on deepwater formation in the North Atlantic Ocean”. It thus supports our argument that the contribution of Greenland melt should not be neglected.
Incidentally, the meltwater hardly has a direct cooling effect in the ‘cold blob’ region – its effect is rather via the dilution of the sea water with freshwater, which reduces the density and thereby hinders the sinking of the water which drives the AMOC.
Is the cold bubble caused by humans?
An important question, of course, is whether the changes in the subpolar Atlantic are caused by humans or are part of natural variability. In my opinion, this is a question of the time scale considered: the variations from year to year are obviously dominated by weather, and also decadal variations – such as the warming (probably the increase of the flow) from 1990 to the middle of the 2000s and the subsequent cooling (slowdown of the flow) – are likely to be mainly natural variations. In contrast, the long-term trend of Dima and Lohmann since 1930 is in my view largely anthropogenic. As the proxy reconstruction in our paper shows, it is probably unique in the context of the previous one thousand years. It is also predicted by climate models in response to the rising greenhouse gas content of the atmosphere.
Regarding the 2015 record cold in the subpolar Atlantic, the arguments are like a mirror image of the discussion about the global heat record of 2015. For the latter the question was El Niño or global warming? The answer is the combination of both. If the natural variation goes in the same direction as the human-caused trend, then a new record can be set. If the natural variation goes in the opposite direction, it can over-compensate the climate trend for a while.
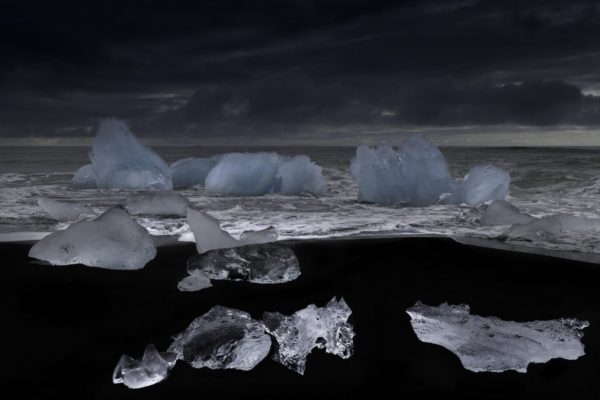
Ice on the coast of Iceland. Photo courtesy of Ragnar Axelsson
What impact does a Gulf Stream System slowdown have?
The potential impacts are increasingly studied, here just briefly a few examples. Haarsma et al. (2015) argue on the basis of model simulation that the weakening of the Gulf Stream system will in the future be the main cause of changes in the atmospheric summer circulation over Europe. Jackson et al. (2015) found that a slowdown is likely to lead to increased storm activity across Britain and parts of mainland Europe. And a new study by Duchez et al. (2016) connects the ‘cold blob’ in the summer of 2015 to the heatwave across Europe that year, because the cold subpolar Atlantic favors a certain air pressure distribution.
A 25-minute video lecture by myself recorded in Iceland last May. Source: Earth101. This project has many more clips with Gavin, Mike, me and other climate scientists – subscribe to their youtube channel (it’s free) to keep them coming.
Could the AMOC break down entirely?
This risk has been discussed since the 1980s, originally due to paleoclimatic data showing a number of abrupt AMOC changes in the course of Earth’s history. It is now well understood that there is a critical tipping point in the system. How far we are from this, however, is not known. Earlier model intercomparisons suggest that a freshwater flow in the order of 0.1 Sv (the equivalent of 3,000 cubic kilometers per year) could be critical. There are some arguments suggesting that models might systematically overrate the stability of the AMOC, which we summarized in PNAS in 2009. An assessment from 2011, commissioned by the European Environment Agency, concluded that the system may be viewed as more sensitive than suggested by earlier assessments.
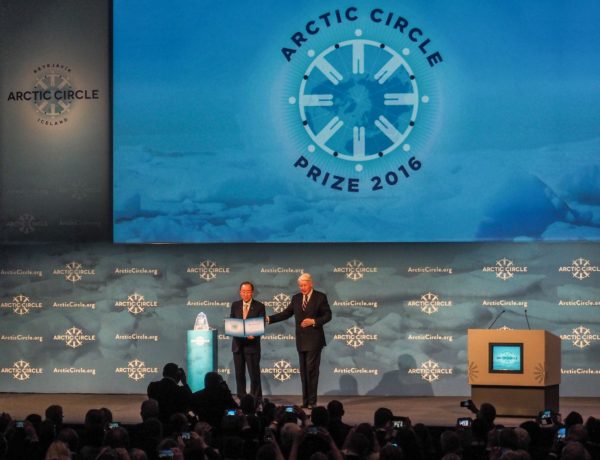
Postscript on the Arctic Circle Assembly. On Saturday, UN Secretary General Ban Ki-moon was awarded the Arctic Circle Prize for his long-standing commitment to the successful conclusion of the Paris Climate Agreement. He received standing ovations from the more than thousand conference participants in the overcrowded hall. In his acceptance speech he emphasised the record-breaking speed in which the agreement has been ratified; after taking the final hurdle a few days ago, it will come into force on 4 November! “What was once considered impossible has now become unstoppable” he said. “We must now turn words into deeds and implement the Paris Agreement. We do not have a plan B, since we do not have a planet B.”
Ban also answered audience questions, and when asked to give a few key lessons he has learned during his time in office, he said: There are many key players, just don’t leave it to governments! He called upon civil society and the business world to push for a low-carbon and climate-resilient economy.
For the evening, the President of Iceland, Guðni Jóhannesson, invited some Icelandic government members (including Prime Minister Sigurður Jóhannsson and Foreign Minister Lilja Alfreðsdóttir) and a handful of scientists to his mansion for a dinner in honor of Ban Ki-moon, where we further discussed the dramatic climate changes in the Arctic and the progress of climate policy.
Link
The Icelandic newspaper Morgunbladid has a special issue for the Arctic Circle Assembly with the magnificent photos and two articles by Ragnar Axelsson and a series of interviews (e.g with Mike Mann from page 20 and with me from page 16).