Serving Spoons and Healthy Habits – Encouraging Positive Mealtimes and Supporting Family Style Meals in Child Care New materials available as part of Nutrition and Wellness Tips for Young Children: Provider Handbook for the Child and Adult Care Food Program (CACFP)

Serving Spoons and Healthy Habits – Encouraging Positive Mealtimes and Supporting Family Style Meals in Child Care

Serving Spoons and Healthy Habits – Encouraging Positive Mealtimes and Supporting Family Style Meals in Child Care

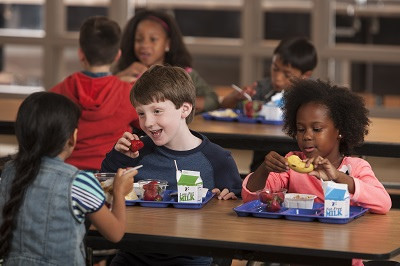
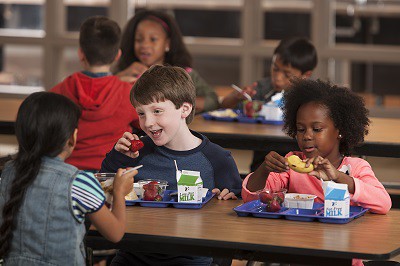
From the foods we serve to the conversations we share, involving young children in mealtimes creates a positive eating environment for everyone to enjoy. The Child and Adult Care Food Program (CACFP) provides almost 4 million nutritious meals and snacks each day to children and adults in child care and group day care settings. These mealtimes provide a tremendous opportunity to help children establish healthy eating habits. CACFP providers are engaging children in cooking, serving, and other mealtime activities as a way to get children interested in new foods and to encourage healthful eating behaviors. 

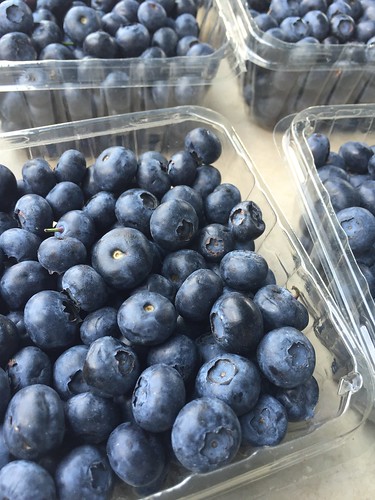
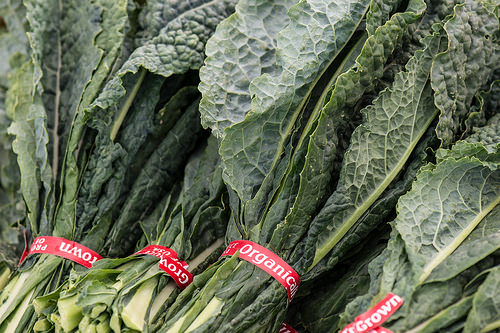
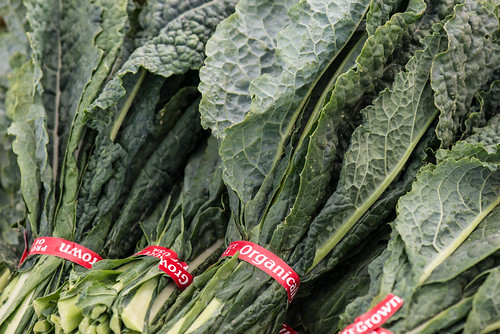
On July 20, 2016, USDA Food and Nutrition Service (FNS) addressed these important topics by adding two new supplemental materials to an existing, comprehensive resource for CACFP providers, Nutrition and Wellness Tips for Young Children: Provider Handbook for the Child and Adult Care Food Program (CACFP). The new supplements, Create a Positive Meal Environment and Support Family Style Meals, offer fun ways child care providers can continue to create positive meal environments and adopt family style meals with children in their care. Through these practices, child care provides can help children try new foods, recognize foods from different food groups in a meal, and practice table manners. Both additions also offer tips and suggestions for including nutrition education activities during and outside of mealtimes. Supplement D: Create a Positive Meal Environment gives tips on how to spark children’s interest in food as well as how child care providers can continue to serve as positive role models when it comes to healthy eating.  Serving, trying, and talking about brightly-colored fruits and veggies are great ways to engage kids at every meal as well as to encourage ‘adventurous eating’. This supplement also outlines examples of how kids from ages 2 to 5 can help with meal preparation. 

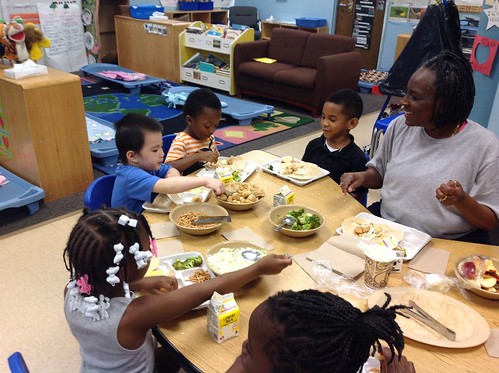
Supplement E: Support Family Style Meals discusses how family style dining can be implemented in child care settings. Family style dining lets children learn by serving themselves.  This helps children develop independence and fine motor skills as well as to eat according to how hungry or full they feel. These basic skills will help children establish healthy habits they’ll use for life.  This resource also includes a special ‘Mythbusters’ section that addresses common concerns related to meal preparation, food costs, and serving styles and practices. 

Supplement D: Create a Positive Meal Environment and Supplement E: Support Family Style Meals are available for download from the Team Nutrition Web site. For more nutrition education materials and resources that can be used at child care, schools, and summer meal and afterschool sites, please visit Team Nutrition’s Resource Library: http://www.fns.usda.gov/tn/resource-library. For more information on the USDA’s Food and Nutrition Service, please visit http://www.fns.usda.gov/.

Promoting Healthy Choices Throughout the School Day

Promoting Healthy Choices Throughout the School Day

Promoting Healthy Choices Throughout the School Day

Schools across the country are working hard to ensure students experience a healthy school environment from the moment they walk in the door until the final bell rings.  Imagine for a second that you are back in sixth grade.  In health class, you’re learning about the food groups and how to eat a balanced diet.  During P.E. class, your teacher stresses the importance of exercise and leading a healthy lifestyle.  School breakfast and lunch included colorful fruits and vegetables, whole grains, and lean protein.  In between periods you are hungry for an afternoon snack from the school’s vending machine. Your eye catches a glimpse of a flashy picture of a bottle of water with a logo down the side of the vending machine, and you think to yourself that water would be a great thirst quencher. Still, you scan the vending machine and see that your options are bottles of water, 100 percent juices, and unsweetened tea—all healthy options! You are thrilled that the school is supporting your resolve to maintain a healthy lifestyle by making healthy choices so readily available. Feeling good about the choices you’ve made so far that day, you are able to choose a healthy snack to compliment the healthy meals you have eaten throughout the day.

Since the passage of the Healthy, Hunger-Free Kids Act of 2010 (HHFKA), school nutrition professionals have been working tirelessly to ensure that kids have access to nutritious, balanced meals…and the progress they’ve made is nothing less than impressive.  More than 98 percent of schools across the country now meet the updated school nutrition standards.  To make the healthy choice the easier choice for kids, now schools will have additional support creating healthy school environments that promote positive choices through the entire school day.

That’s why USDA is publishing the Local School Wellness Policy and the Smart Snacks in School final rules.  The Local School Wellness Policy final rule puts in place common-sense standards on any food or beverage marketing targeted at kids during the school day.  Seventy percent of elementary schools have some kind of food or beverage marketing.  This messaging surrounds students in their place of learning; therefore, it is vital that it is consistent with what they are being taught through nutrition education.  The Smart Snacks in School final rule also helps ensure consistency by implementing nutrition standards on foods that are sold to children outside of school breakfast or lunch meals.  The standards in these two final rules will help equip students to make healthy choices not only during the school day, but also outside of school and throughout the rest of their lives.

The Local School Wellness Policy final rule also requires schools to solicit stakeholder participation in the annual development of local school wellness policies.  This empowers parents and communities to take an active role in the health of their children.  USDA also recently published the Community Eligibility Provision final rule and the Administrative Review Process final rule, which strengthen access to school meals and increase integrity and compliance in school meal programs, respectively.

Together, these rules play a pivotal role in encouraging today’s youth to continue to make healthy food choices by promoting consistency, collaboration, access, and integrity.  The standards build on the positive, incremental changes we’ve seen under HHFKA and further the ultimate goal of building a healthier next generation.

Forest Digest — Week of July 18, 2016

Find out the latest in forest news in this week’s Forest Digest!Baby cougar

How Much are Forests Worth?

By Lindsay Seventko, Communications Intern

ForestAs forest lovers, we know that forests are worth more than the sum of their timber price or the income that the recreation industry receives. But, how do you convey the importance of protecting and restoring our forests to the millions of Americans who have no interest in walking among ancient trees, discovering rare wildlife deep within wilderness, or leaving valuable urban spaces green? Part of the answer is in quantifying the economic value of our forests, a large undertaking that will likely not be completed for many years. In the meantime, here are some ways to talk to those who don’t share the appreciation for all the wonderful ways that forests benefit our lives.

Take a small urban forest of 100 deciduous trees. Sure, there are aesthetic and recreational values associated with that area which, in most people’s minds, justifies spending about $142,000 on planting and maintaining them over the course of a normal 40-year lifetime. However, when broken down by all the benefits of that small forest, the return on investment is significant.

That small plot of trees will remove 53 tons of carbon dioxide each year and 430 pounds of air pollutants, decreasing medical bills relating to asthma and lung issues. They will collect about 139,000 gallons of rainwater every year, increasing water security and decreasing costs associated with run-off damage and storm water pollution problems. Shoppers in the city will spend more time in the area, pay more for parking and be willing to spend about 12 percent more for their products. The houses in the immediate area will save up to 56 percent on air conditioning costs every year, and marginally (1 percent) on heat in the winter, when the trees are strategically placed around their house. Even domestic violence rates may decrease. All of these benefits combined will add at least $232,000 net profit (as a most conservative estimate) on the investment of this small urban forest.[1]

Magnified out to the state level, in Tennessee alone, complete deforestation would result in an $80 billion loss of assets.[2] In New York, a $1 billion investment in improving land management practices and replanting trees was effective enough to avoid having to build a new water treatment facility that would have cost six to eight times that price. Taxpayers saw a 9 percent increase in bills, as opposed to the doubling that otherwise would have occurred.[3] In California, researchers found that urban trees removed the carbon dioxide equivalent of 120,000 cars’ emissions, and valued the trees at $2.49 billion in assets. For every $1 spent on a tree, $5.82 in benefits were returned.[4]

Just for a moment, imagine how much the value of vast, untouched forests will exponentially increase beyond these isolated examples. It’s been estimated that simply cutting deforestation rates in half over the next 15 years would save about $3.7 trillion in climate change related costs alone, because of the amount of carbon sequestered.[5] The actual value of the forests is much higher when all the other ecosystem and social benefits are taken into account.

Our forests will always have intrinsic and spiritual value that has not yet been able to be fully accounted for in monetary terms. Nevertheless, assigning a comprehensive economic value to our forests is a way of ensuring that they are universally recognized for the benefits that they bring to all of humanity — from carbon storage to water and air purification, wildlife habitat, mental health improvements and countless other services. With these efforts, even those who wouldn’t dream of traipsing through a dense forest, could help ensure that they are valued, protected and restored as the necessary assets they are.

[1] “Trees Pay Us Back” USDA Forest Service and NY State Department of Environmental Conservation: n.d.

[2] Berg, Nate. “The High Cost of Losing Urban Trees.” CityLab: April 9, 2012.

[3] “New York City” Watershed Case Studies, Information Center for the Environment. UC Davis: n.d.

[4] McPherson et al. “Structure, function and value of street trees in California, USA.” Urban Forestry & Urban Greening. 17:104-115.

[5] “Ecosystem Restoration for Climate Change Mitigation” Dead Planet, Living Planet. GRIDA: n.d.

USDA Grants Helping the Specialty Crop Industry Reach Food Safety Goals

Fresh blueberries

Fresh blueberries

Across the country, farmers growing fruits, vegetables, tree nuts, dried fruits, horticulture and nursery crops – or specialty crops – are being asked to be certified in USDA’s voluntary audit program, Good Agricultural Practices (GAP).  From restaurants and hotels to schools and institutions, wholesale buyers want to ensure the fruits and vegetables they purchase meet food safety standards under the Food and Drug Administration’s (FDA) Food Safety Modernization Act (FSMA).  One challenge for growers in many states is the lack of in-state auditors to perform the GAP certification reviews.

One solution has been to leverage another USDA resource to educate and train producers, handlers and buyers on-farm food safety practices. USDA’s Agricultural Marketing Service (AMS) offers Specialty Crop Block Grants (SCBG) to enhance the competitiveness of specialty crops which includes supporting GAP certification audits. Since 2006, these grants have launched over 107 GAP and Good Handling Practices (GHP) outreach and training projects, and funded 116 GAP/GHP cost share projects through State departments of agriculture.

For example, a SCBG grant was awarded to the Connecticut Department of Agriculture in partnership with University of Connecticut Cooperative Extension Food Safety Educators.  Together they tailored a program to help the state’s specialty crop producers to understand on-farm food safety practices, incorporate on-farm food safety practices, and prepare for an on-GAP audits. In total 20 meetings or workshops were held, some with over one hundred attendees, with a total reach around thousand people interested in specialty crops, food safety and GAP certification.

As a result Connecticut Department of Agriculture was able to accomplish GAP audits for both field-grown and greenhouse-grown crops. Over a three year grant period, 41 specialty crop growers were GAP certified, exceeded expectations and showing the demand for certification. This program provided a valuable service and enable specialty crop producers to sell their products to customers requiring a GAP audit.

Farmers in Connecticut requested GAP audits when a customer would not buy from them unless they were certified. Since the FSMA was passed in 2011, staff in the AMS Specialty Crops Program have been working closely with the FDA on the Produce Safety Rule required by the law. We also have been working with industry to be sure they understand how this rule affects their operations and how we can help them comply with the rule.  USDA will continue to work with the FDA as we align our GAP and GHP programs with the FSMA Produce Safety Rule and offer resources to help specialty crop producers be successful.

Researchers Use NIFA Grant to Develop Rapid Food Safety Test

Measurement setup for direct pathogen detection on food

Measurement setup for direct pathogen detection on food. (Courtesy of Dr. Bryan Chin)

July is the height of summer grilling season, and throughout the month USDA is highlighting changes made to the U.S. food safety system over the course of this Administration. For an interactive look at USDA’s work to ensure your food is safe, visit the USDA Results project on Medium.com and read Chapter Seven: Safer Food and Greater Consumer Confidence.

Keeping the food on America’s tables safe to eat is a major priority at USDA, where we are constantly working to find innovative ways to stay a step ahead of bacteria and other dangerous contaminants that can cause illness. Thanks in part to a grant from USDA’s National Institute of Food and Agriculture (NIFA), a research team led by Dr. Bryan Chin, director of the Auburn University Detection and Food Safety Center, has developed a cheap, portable and easy-to-use new screening tool to test fresh fruits and vegetables for the presence of bacteria that can cause foodborne illnesses.

Currently available screening methods for produce can be costly in terms of time, equipment, and expertise. The multidisciplinary research team of engineers, microbiologists, and genomicists based at Auburn University and the University of Georgia wanted to create a new method that could be used more broadly.

The team has developed biosensors that are placed directly upon the fresh fruits or vegetables being analyzed. The eyelash-size biosensors are coated with antibodies and phages (viruses that target specific bacteria) and vibrate when placed within an oscillating magnetic field. If targeted bacteria are present, they bind to the antibodies and phages and change the vibration frequency of the biosensor. These frequency changes help inspectors determine the type and amount of bacteria on a given fruit or vegetable.

“The technology gives us a revolutionary new capability to directly detect food pathogens,” Chin said. It is fast and has both high specificity and sensitivity. In less than 12 minutes, the sensors can detect as few as five hundred Salmonella cells amid a sea of a million bacterial cells. The measurement system costs $750, with each of the disposable biosensors costing less than 1/1000 of a cent.

The biosensors are still in the research and development stages. Moving forward, Chin has his sights set on developing a technology that is even faster and is capable of screening an entire bulk shipment of product, removing sub-sampling entirely.

USDA consistently conducts and funds food safety research to generate real-world results for both government and the private sector. In 2014 alone, USDA’s NIFA provided more than $112 million for food safety research, education and extension projects to help build a modern public health system. Read more about how USDA’s food safety improvements over the past seven years are leading to a safer food supply at www.medium.com/usda-results.

NIFA invests in and advances agricultural research, education and extension and seeks to make transformative discoveries that solve societal challenges.

Cold War Heroes Honored by U.S. Forest Service

A vault filled with personal mementos from the victims’ loved ones lies at the foot of the Silent Heroes of the Cold War Memorial

A vault filled with personal mementos from the victims’ loved ones lies at the foot of the Silent Heroes of the Cold War Memorial. The marble slab that covers it is blank, signifying the secrecy under which these heroes worked. Photo credit: US Forest Service

The Cold War was called a war for a reason—many died in the defense of democracy and free markets.

To honor those who died in the Cold War era, which lasted for more than 40 years, the Humboldt-Toiyabe National Forest’ Spring Mountains National Recreation Area partnered with Silent Heroes of the Cold War and GO Mt. Charleston to dedicate the Visitor Gateway site, home to the Silent Heroes of the Cold War Memorial.

The new site is our nation’s first national memorial honoring the lives lost during the Cold War.

The Cold War Memorial features the twisted remains of the propeller from a military transport plane that crashed on Charleston Peak on November 17, 1955. The aircraft had been secretly carrying personnel to Area 51 to work on the development of the U2 spy plane. Information about the crash remained classified for decades, leaving bereaved family members with no explanation or sense of closure.

But in 1998 local Boy Scout troop leader Steve Ririe found some of the remaining wreckage while hiking on the mountain. Curious, he began to investigate the recently declassified crash. With help from local resident Marian Kennedy, Ririe located the victims’ family members and shared what he had learned.

The family’s appreciation inspired Ririe to propose a memorial site dedicated to the tragedy and to other unsung heroes of the Cold War, many of whom worked in secret and died in silence to keep America safe.

With support from Senator Harry Reid, and the U.S. Forest Service, Ririe’s vision finally became a reality, and the Silent Heroes of the Cold War Memorial was completed in 2015.

“The Memorial honors all Cold War heroes, but especially recognizes those whose contributions were purposefully erased from history,” said Ririe. “These silent heroes kept the nuclear threat at bay. Because they were successful we will never know the full extent of our debt we owe them.”

At the Spring Mountain site, last Memorial Day, the first ceremony to honor the Cold War fallen was held. It also marked the first opportunity for the Las Vegas community to come together to pay tribute.

The twisted remains of a propeller for a Cold War military transport plane

The twisted remains of a propeller for a Cold War military transport plane that crashed on Charleston Peak on November 17, 1955, just outside Las Vegas. The aircraft had been secretly transporting personnel to Area 51 to work on the U2 spy plane. Photo credit: US Forest Service

Relationships and Technology Are the Keys to Better Data for Farmers and Ranchers

NASS Administrator Hubert Hamer speaking to a small farms conference

Hubert Hamer speaks to a small farms conference about the value of NASS data and the importance of responding to NASS surveys.

Like nearly all organizations that use surveys to collect information, we have seen declining response rates in recent years. The value of accurate data is now more important than ever for decision-making on the farm, and by USDA farm program administrators, policy makers, researchers, market participants and, really, every aspect of agriculture. It is critical that we work closely with potential respondents and their industry representatives.

End-of-year crop production and stocks surveys, including the county agricultural production survey, which are critical for the Farm Service Agency and the Risk Management Agency to administer programs that benefit farmers and ranchers are upon us.  These agencies need accurate data to serve producers with beneficial programs such as the Price Loss Coverage (PLC), Agriculture Risk Coverage (PLC), Conservation Reserve Program (CRP) and many crop insurance programs.

Thankfully, we have amazing technology to help us that I couldn’t imagine using 30 years ago. I think George Washington, one of the earliest compilers of ag data, and those who later produced the first census of agriculture in 1840 would be astounded.  We harness satellite imagery, online survey response tools, tablet-based data collection during personal interviews in the field, and many more systems.  It seems like we have new tools almost daily and we are tapping them to make it easier and more convenient for those who receive surveys to respond. New technologies also make data analysis and publication more efficient and accurate for us.

Just a month ago, I became the eighth administrator of the National Agricultural Statistics Service, the agency charged with producing official federal data on U.S. agriculture.  When I joined NASS as a recent graduate of Tennessee State University many years ago, technology and how we did our work was quite different, but our mission remains the same – to produce accurate, timely and useful statistics in service to U.S. agriculture.  Service and our commitment to U.S. agriculture are what drives us at NASS and to that end, I have three areas of focus: 1. Relationships with survey respondents, 2. Advancing our use of technology to ensure data quality and usability; and 3. NASS employees.

In turning to our staff, my goal is to have an environment where our outstanding employees can do their best work.  This includes a safe and inclusive workplace with diversity of people and ideas; where vigorous, respectful debate is encouraged and where employees can continue to harness their talent and work ethic to fulfill both their career goals and our agency mission.  My expectation is that everyone who interacts with NASS staff anywhere in the country finds us to be helpful, pleasant and professional.

We are proud of the work we do in service to U.S. agriculture and want each person involved in agriculture to know the value of the data we produce and how to use it to meet their needs and interests.  This especially holds true for farmers and ranchers who fill out surveys but may not immediately see the connection to crop insurance price elections, FSA programs or even ways to use the information to inform land use decisions in their own communities. If you’d like to learn more about our data, please feel free to contact us at an office near you or look on our website.

A Moment in Time Look at Organic Retail Prices

Organic "dinosaur" kale grown at Ground Stew Farms in San Martin, Monterey County, CA

AMS plays an integral role by providing organic data, standards, and other resources to small producers and consumers across the country.

Consumers can find certified organic products at most grocery stores and demand for organic products continues to increase, with U.S. retail sales valued at more than $43 billion in 2015.  Organic products are grown, raised and produced by over 31,000 certified operations, and many of those operations receive higher prices, or premiums, for their products.

Recently, USDA’s Economic Research Service (ERS) issued a report entitled Changes in Retail Organic Price Premiums from 2004 to 2010.  The report highlights the retail price premium charged for organic foods compared to conventional products.  For the report, ERS used a virtual shopping basket of 17 products and data collected from Nielsen scanners to calculate the organic prices and how they changed from 2004-2010.

USDA Market News – administered by USDA’s Agricultural Marketing Service (AMS) – has expanded upon this research to find current year-to-date organic prices, as well as the current prices for selected commodities using weekly advertised specials.

By using these retail advertised prices captured “at a moment in time” in the weekly National Retail Report, USDA Market News shows a current price premium for selected items and the six month average for the same items.  The data allows a near-real time look at the prices from weekly advertised specials from about 330 chain groceries, with nearly 26,000 individual stores nationwide.  The information is collected by AMS Market Reporters from grocery store ads.

While looking at the 2016 data for current retail advertisements, Market News found that the organic price premiums for eggs and milk were among the highest for all commodities, while salad mix was the highest among the produce items.  Fresh fruits and vegetables reflected a broader range in the premium prices depending on the specific item.  The prices charged for organic versus conventional products are generally higher, with organic items running higher in the advertised weekly specials in the July 1, 2016, time period.  These premiums are often a reflection of consumer demand and the additional production and handling costs it takes to produce organic food.

Prices for organic products are occasionally lower than their conventional counterparts, such as red delicious apples in the June 10th period.  In the report on that date, organic red delicious apples were offered at a negative premium of 20 percent under conventional red delicious apples.  As expected, throughout any given year, consumers may find a seasonal gradation of price premiums for organic produce.

By publishing current prices, USDA Market News reports give organic farmers, producers and other agricultural businesses the information they need to evaluate market conditions, identify trends, make purchasing decisions, and monitor price patterns.

As consumer demand for organic food keeps growing, USDA Market News and other AMS programs – including USDA’s National Organic Program – continue to play an integral role by providing data, standards, and other resources to small producers and consumers across the country.

Following Water in the Rocky Mountains

Tom Brown hiking Chasm Lake

Tom Brown hiking Chasm Lake, Rocky Mountain National Park. Photo credit: Tom Brown

In cycling the Continental Divide in Colorado, you get a vivid picture of where much of our water comes from. During my long bike rides up there, I commonly find snow still melting in June. This snowmelt adds to streamflow that becomes our renewable water supply and my drinking water supply.

The part of rain and snowfall that does not naturally go back into the atmosphere becomes our water supply and it varies greatly across the United States. In the wettest regions, such as New England, precipitation is plentiful and about half of it ends up in streams or replenishes ground water supplies.

At the other extreme—that is, in much of the Southwest—precipitation is scarce and only about five percent of it becomes part of the water supply. The rest evaporates or is used by natural vegetation. Across the Interior West, a region from Arizona and New Mexico to Montana and North Dakota, about 13 percent of precipitation goes into the water supply in an average year.

In the west, most precipitation falls in the high country, where temperatures and evaporation are lowest, meaning it is the source of the majority of the renewable water supply. And that is lucky for the people who live in the west, because much of the high country mountains are forested or protected, so that the quality of the resulting streamflow tends to be very good.

For the United States as a whole, about 55 percent of our drinking water comes from diverting surface flows. The rest is obtained by pumping ground water.

The quality of that water is vitally important. When it comes to diverting surface water, what happens on the watershed upstream is essential, because it determines the downstream financial cost of bringing the water up to drinking water quality standards.

In general, the closer you live to protected land or to forested land, the better is the water quality of the streamflow.

Across the west, nearly 50 percent of the renewable water supply in an average year originates on or adjacent to National Forest land, with another 6 percent coming from National Park lands. And across the west, depending on how forests are defined, 58 to 77 percent of the renewable water supply originates on forests, with some additional water flowing from high-elevation alpine areas.

In the northeast 60 percent of the renewable water supply originates in forests. It is not an exaggeration to say that forests and protected lands play an extremely important role in the provision of water in the United States.

As I play in and around our forests in the west, I am always aware of where my water comes from.

An outdoors enthusiast cross-country skiing near Cameron Pass

An outdoors enthusiast cross-country skiing near Cameron Pass, Arapaho-Roosevelt National Forest. Photo credit: Tom Brown