American Forests Co-Authors New Study on the Impacts of Forest Management on Soil Carbon American Forests is excited to share newly published research on forest soil carbon dynamics. This study, which focuses on the impacts of forest management and disturbance on soil carbon, will help to provide practical guidance
We watch long YouTube videos so you don’t have to.
In the seemingly endless deliberations on whether there should be a ‘red team’ exercise to review various climate science reports, Scott Waldman reported last week that the original architect of the idea, Steve Koonin, had given a talk on touching on the topic at Purdue University in Indiana last month. Since the talk is online, I thought it might be worth a viewing.
[Spoiler alert. It wasn’t].
The red team issue came up a few times. Notably Koonin says at one point in the Q and A:
The reports are right. But obviously I would not be pushing a red team exercise unless I thought there were misleading crucial aspects of the reports.
55:55
But in over an hour of talking, he doesn’t ever really say what they are. Instead, there are more than a few fallacious arguments, some outright errors, some secondhand misdirection, a scattering of dubious assumptions and a couple of very odd contradictions. I cannot find a single instance of him disagreeing with an actual statement in the reports.
First, the fallacies
Three examples:
Until you explain variability on all the scales relevant to the alleged human warming, you haven’t really nailed it down.
21:10
Nope. This is basically claiming that until you know everything (an impossible task), you know nothing.
33:00. Apparently, Koonin “doesn’t think” rapid sea level rise is going to happen in the future because it hasn’t happened over the last 100 years at the Battery in NYC.
35:40. Koonin skips his slide on why Arctic sea ice trends aren’t anything to worry about, but his point was going to be that people noticed warming in the Arctic in 1923. This is of course another fallacious argument (and we’ve dealt with it before).
Contradiction Central
There are two glaring sets of contradictions in the talk, first, involving attribution of past change and secondly, his stance on normative judgements in discussing science. Starting around 7:29 he discusses attribution of recent trends and states:
You had better have [natural influences] under control before you can attribute what you see to human influences.
This is fair enough (assuming he means that one should have a good handle on natural variability rather than ‘controlling’ it), and one might read this as a statement that attribution is complex and deserves careful attention – an opinion with which I fully concur. But this is illustrated with the most useless kind of pop attribution. He makes a blanket statement that any changes prior to 1950 must be purely ‘natural’ without any analysis at all (a stance completely at odds with the literature, for instance, Hegerl et al., 2018), and supports it with an uncredited graph from, of all people, Bob Tisdale, a frequent blogger at WUWT, showing running 30 year trends of the (now obsolete) HadCRUT3 data. That’s an interesting choice of metric because it is the longest trend period you can use that allows the ~1940 rise to almost match the more recent decades. With 35 year, or 40 year, or 50 year or 60 year trends, the exceptional nature of the recent change is obvious.
His second contradiction concerns his statements about normative values. He, of course, claims to make no normative statements, while implying others (unnamed) are perverting their science to do so. And yet, not only is his talk filled with his opinions, he has a remarkably different approach to the climate science results than to the results from economic modeling. For the former, he is hyper-critical (mostly without any valid cited reasons), while for the latter he appears naively credulous. This, at best, is incoherent, since the economic projections are rife with embedded normative values.
For instance, he uses a standard contrarian argument that future damages associated climate change will be a small fraction of the expected economic growth and therefore do not need to be mitigated. But the models that produce that result simply assume that no amount of damage from climate change can effect the exogenous growth rate. Additionally, they assume that damages themselves are simply proportional to the square of the temperature anomaly. You can judge how credible these assumptions really are. Of course, if we are to be ridiculously better off in the future without any effort, then the estimated costs of mitigation (also a few % of GDP) are also irrelevant.
Koonin gives his summary around 47:00, after spending a fair bit of time correctly describing the size of the challenge involved in stabilizing climate. But then he just shrugs and assumes that it is too big to ever be dealt with. This is not a conclusion that “just comes from the numbers”. He clearly has a normative preference for adaptation (seemingly oblivious to the point that it is very hard and very costly to adapt to a continuously changing, and even accelerating situation). Whether or not mitigation will be too hard, it is undoubtedly a normative decision to give up trying.
Errors galore
Some of these are trivial, some are more consequential, but all are illustrative of someone who is not well-versed in the topic.
At 14:40, he claims that climate models take time steps of 6 hours. It would be a little hard to resolve the diurnal cycle with that. The correct value is more like 15 to 30 min for the column physics, and more like 2 or 3 minutes for the advection routines. Curiously, even the slide he is talking to says this.
18:45. he says that Figure 9.8 in IPCC AR4 (2013) was ‘misleading’ because it showed anomaly temperatures alongside the range of absolute mean global values. This is odd. If the sensitivity of the model is not dependent on the base state, this is a good result.
20:34. he claims that the CMIP5 models were tuned to 20th Century trends, which is why without anthropogenic forcings they show no trend. This makes no sense at all. First, it is just untrue that all the models were tuned on the trends. And second, if there is no big trend in the natural forcings, you just aren’t going to get a big long term trend in the response. Nothing to do with tuning.
21:06 Another graphic borrowed from Bob Tisdale. This one makes the classic error of confusing the forced trend (as estimated from the mean of model ensemble) with the actual trend (which includes the actual forced trend and internal variability). For someone who claims to be interested in how internal variability is represented in models, that’s an odd lacuna.
26:00. His slide 25 is just BS from start to finish. Note there are no actual quotes from any specific case – everything is a strawman argument.
28:05. He quotes me! This is not an actual error, but I find it funny that my views on how the media treats extremes (at least in 2013) are worthy of inclusion, but not, say, my views on climate modeling or attribution (you know, my job).
31:00. Satellite records of sea level rise (since 1992) “are commensurate” with the tide gauge estimates (roughly 2mm/yr). Sure, but Koonin mysteriously neglects to mention they are 50% higher than the long term trend from those gauges. Also missing from his commentary on longer term records is that even the modern tide gauge-derived rate is more than twice the Holocene trends since 6000 BP (see for instance, Ashe et al., 2018).
34:10 “If you get all your climate information from watching CNN or reading the New York Times or Washington Post [the data on hurricanes] is a surprising statement”. Apparently, these outlets report on hurricane trends so frequently and so erroneously that no reference to them actually doing so is needed. Ok then.
50:02. “I would do more when the signal has come out of the noise, which it has not yet”. This is complete rubbish. The signals of temperature change, sea level, sea ice loss, intense precipitation, heat waves, phenology, permafrost loss, Greenland melt, ocean heat content etc. have all clearly ‘come out of the noise’. What is he really waiting for?
Is there anything new here?
This is what I don’t really understand: There is absolutely nothing new here. Every argument, point, and even some graphics, are old, stale, and previously rebunked. These points could have been made (and undoubtedly were) in official reviews of assessment reports going back years. The people making these points have undoubtedly been told this and shown responses. In Koonin’s case, I know this for a fact (for instance). And yet, they persist. There is no development of the arguments, no counter-points, no constructive back and forth, just the same arguments that they appear to have thought up once and never examined.
Personally, I like taking on smart criticisms. They help hone the science, clarify the arguments and point to areas of needed research. But there isn’t a single thing here worth taking on.
Two thumbs down.
References
G.C. Hegerl, S. Brönnimann, A. Schurer, and T. Cowan, “The early 20th century warming: Anomalies, causes, and consequences”, Wiley Interdisciplinary Reviews: Climate Change, vol. 9, pp. e522, 2018. http://dx.doi.org/10.1002/wcc.522
Hilary Franz, Washington State Commissioner of Public Lands, Receives American Forests’ Inaugural Forest Resilience Champion Award First of its kind award presented to Franz, a third-generation farmer, small forest landowner and elected servant of the Washington State Department of Natural Resources (Washington, DC) – American Forests presented its inaugural
Job Title: Senior Director of Urban Forestry Department: Conservation Programs Reports to: Vice President of Urban Forestry FLSA Status: Exempt Updated: June 7, 2019 SUMMARY: The senior director of urban forestry is responsible for planning and overseeing the implementation of American Forests’ urban initiatives. The equivalent of a chief
Guest commentary by Karsten Haustein, U. Oxford, and Peter Jacobs (George Mason University).
One of the perennial issues in climate research is how big a role internal climate variability plays on decadal to longer timescales. A large role would increase the uncertainty on the attribution of recent trends to human causes, while a small role would tighten that attribution. There have been a number of attempts to quantify this over the years, and we have just published a new study (Haustein et al, 2019) in the Journal of Climate addressing this question.
Using a simplified climate model, we find that we can reproduce temperature observations since 1850 and proxy-data since 1500 with high accuracy. Our results suggest that multidecadal ocean oscillations are only a minor contributing factor in the global mean surface temperature evolution (GMST) over that time. The basic results were covered in excellent articles in CarbonBrief and Science Magazine, but this post will try and go a little deeper into what we found.
Until recently, the hypothesis that there are significant natural (unforced) ocean cycles with an approximate periodicity of 60-70 years had been widely accepted. The so-called Atlantic Multidecadal Variability index (AMV, sometimes called the AMO instead), but also the Pacific Decadal Variability index (PDV) have been touted as major factors in observed multidecadal GMST fluctuations (for instance, here). Due to the strong co-variability between AMV and GMST, both, the Early 20th Century Warming (1915-1945) and the Mid-Century Cooling (1950-1980) have been attributed to low-frequency AMV variability, associated to a varying degree with changes in the Atlantic Meridional Overturning Circulation (AMOC). In particular, the uncertainty in quantifying the human-induced warming fraction in the early 20th Century was still substantial.
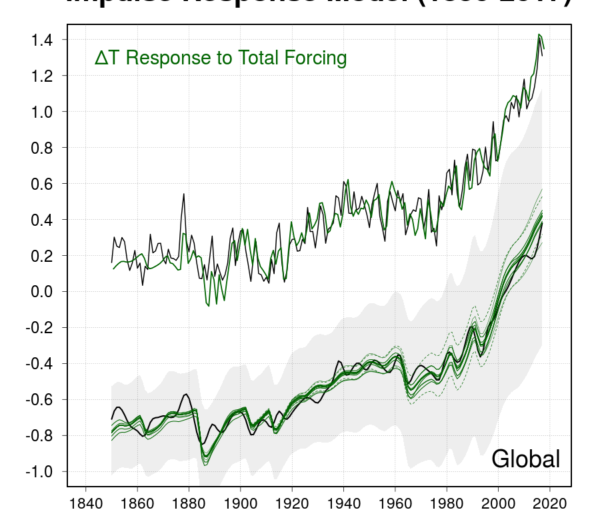
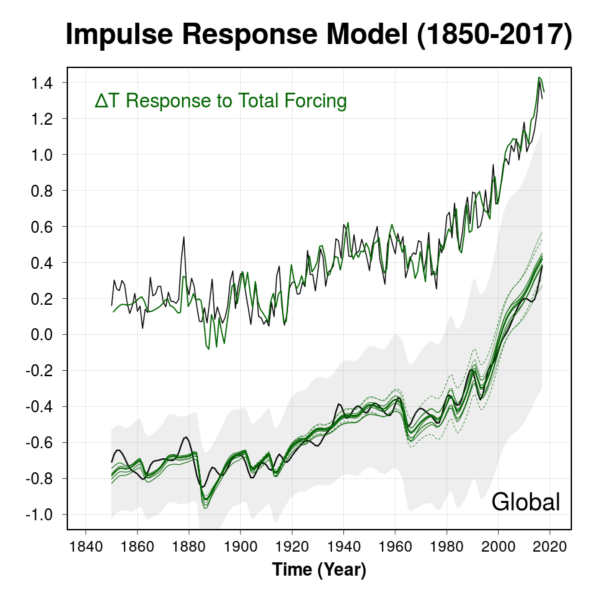
Fig. 1: Matches of modeled temperature to the observations since 1850. Upper graph shows the global response model with ENSO (bold green) compared to HadOST (bold black). Lower graph is the same as above but with lowess smoothed observational data. The response model results (green thin lines) represent the parameter uncertainty for an associated TCR of 1.6K. The dashed thin line is the upper and lower (reasonable) bound for the effective aerosol forcing for 2017 (-0.5 and -1.0 W/m2), in contrast to the best estimate of -0.75 W/m2 used in the response model. The grey area indicates the 5-95th percentile of the total uncertainty. The two graphs are offset by 0.9°C without a particular baseline. Response model and observations are aligned for the 1901-2000 period.
In contrast to those earlier studies, we were able to reproduce effectively all the observed multidecadal temperature evolution, including the Early Warming and the Mid-Century cooling, using known external forcing factors (solar activity, volcanic eruptions, greenhouse gases, pollution aerosol particles). Adding an El Niño signal, we virtually explain the entire observed record (Figure 1). Further, we were able to reproduce the temperature evolution separately over land and ocean, and between Northern and Southern Hemispheres (NH/SH). We found equally high fractions of explained variability associated with anthropogenic and natural radiative forcing changes in each case. Attributing 90% of the Early Warming to external forcings (50% of which is due to natural forcing from volcanoes and solar) is – in our view – a key leap forward. To date, no more than 50% had been attributed to external forcing (Hegerl et al. 2018). While there is less controversy about the drivers of the Mid-Century cooling, our response model results strongly support the idea that the trend was caused by increased levels of sulphate aerosols which temporarily offset greenhouse gas-induced warming.
What does this mean?
Some commentators have used the uncertainty in the attribution for the Early 20th Century warming as an excuse to not accept the far stronger evidence for the human causes of more recent trends (notably, Judith Curry). This was never very convincing, but is even further diminished given a viable attribution for the Early Warming now exists. Despite a number of studies that have already provided evidence – based on a solid physical underpinning – for a large external contribution to observed multidecadal ocean variability, most prominently the AMV (e.g. Mann et al., 2014; Clement et al., 2015, Stolpe et al. 2017), ideas such as the stadium wave (Wyatt and Curry, 2014) continue to be proposed. The problem is that most studies that argue for unforced low-frequency ocean oscillations do not accommodate time-varying external drivers such as anthropogenic aerosols. Our findings highlight that this non-linearity is a crucial feature of the historic forcing evolution. Any claim that these forcings were/are small has to be accompanied by solid evidence disproving the observed multidecadal variations in incoming radiation (e.g. Wild 2009). On the contrary, our findings confirm that the fraction of human-induced warming since the pre-industrial era is bascially all of it.
Implications
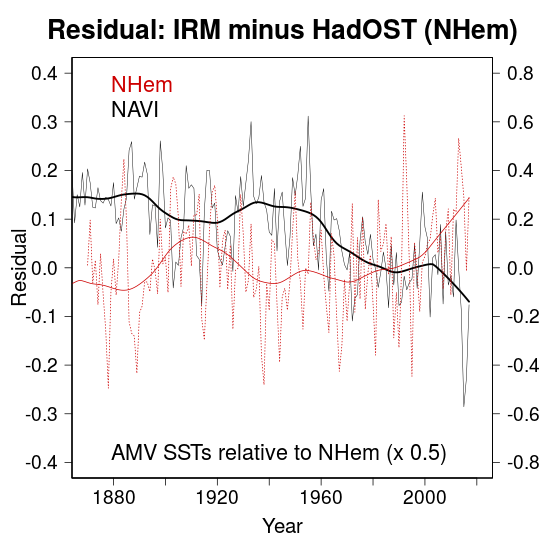
Fig 2. The residual observed variability in the NH. Model minus 30 year smooth observations (red). A revised AMV index is shown in black. Note that the rhs y-axis labels for the AMV SSTs is different.
We conclude that the AMV time series (based on the widely accepted definition) almost certainly does not represent a simple internal mode of variability. Indeed, we think that the AMV definition is flawed and not a suitable method to extract whatever internal ocean signal there might be. Instead we recommend the use of an alternative index which we think will be closer to the internal signal, called the North Atlantic Variability Index (NAVI). It is essentially the AMV relative to the NH temperature (Figure 2). The resulting timeseries of the new NAVI index is a good representation of the AMOC decline, arguably the true internal component (although also forcing-related) in the North Atlantic. This implies that while the AMOC is an important player (see for instance, Stefan’s RC post), it is not driving alleged low-frequency North Atlantic ocean oscillations. The AMV should therefore not be used as predictor in attribution studies given that the multidecadal temperature swings are unlikely internally generated. Though we note that the projection of AMV on GMST is small in any case.
What did our results rely on?
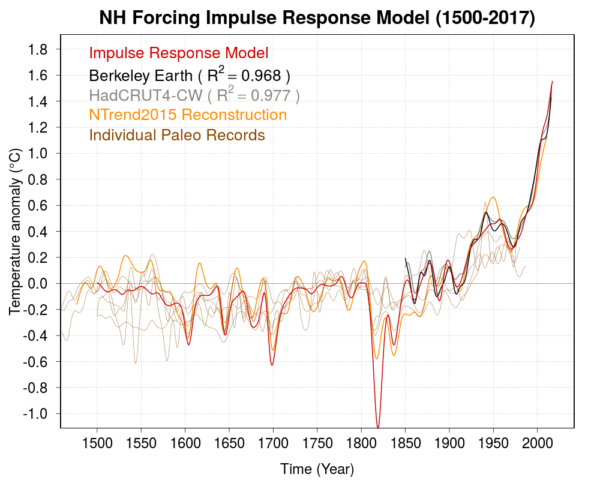
Fig 3. NH response model results from 1500-2017 (bold red). NTrend proxy in orange and a subset of individual NH proxy reconstruction (thin brown lines). HadCRUT4 and Berkeley in grey and black for the 1850-2017 period. The response model is baselined to the initialisation data which corresponds to 1500 A.D.
There are three novelties that led to our conclusions: (1) We differentiate between forcing factors such as volcanoes and pollution aerosols with regard to their transient climate response (TCR). For example, anthropogenic aerosols are primarily emitted over NH continents, i.e. they have a faster TCR which we explicitly account for in our analysis. (2) We use an updated aerosol emission dataset (CEDS, Hoesly et al., 2017, also used in CMIP6), resulting in a substantially different temporal evolution of historic aerosol emissions compared to the older dataset (Lamarque et al. 2010). The effective aerosol forcing is based on the most recent estimate by [9]. (3) The final change is related to the observational data. The HadISST1/2 (Kennedy et al. in prep) ocean temperature dataset (SST) has never been used in conjunction with land data. We have combined HadISST2 with Cowtan/Way over land (using air temperature over sea ice) and filled the missing years after 2010 with OSTIA SSTs (due to it being preliminary only). In addition, it has been known for quite some time now that there is a bias in virtually all SST dataset during the 2nd world war (Cowtan et al., 2018, and see also Kevin’s SkS post). We correct for that bias over ocean (1942-1945), which, in conjunction with warmer HadISST2 SSTs before the 1930s, significantly reduced previous discrepancies related to the Early Warming. Lastly, the fact that the model is initialised in 1500 A.D. ensures that the slow response to strong volcanic eruptions is sensibly accounted for (Figure 3), as it has shown to be important on centennial timescales (e.g. Gleckler et al. 2006).
What
about overfitting?
In
order to address this issue, we would like to point out that not a single
parameter depends on regression. TCR and ECS span a wide range of accepted
values and all we did is to estimate TCR based on the best fit of the final
response model result with observations. We concede that the fast response time
and the effective aerosol forcing are difficult to pin down given there is a
wide range of published estimates available. However, it is worth mentioning
that the results are not very sensitive to variations in both parameters (see
thin lines in Figure 1). Instead, the overall uncertainty is dominated by the
TCR and GHG forcing uncertainty. The story is more complex when it comes to the
NH/SH and land/ocean-only results as we need to account for the different
warming-ratios. Guided by climate model and observational data, we introduce a novel
method that objectively estimates the required TCR factors.
Conclusions: It was us.
The findings presented in our paper highlight that we are now able to explain almost all the warming patterns since 1850, including the Early Warming period. We achieve this by separating different forcing factors, by including an updated aerosol dataset and by removing notable SST biases. We have avoided overfitting by virtue of a strict non-regression policy. We ask the different research communities to take these findings as food for thought, particularly with regard to the Early Warming. We most definitely believe that it is time to rethink the role of the AMV and recommend using our newly introduced NAVI definition instead. This will also help to understand contemporary AMOC changes and its relation to climate change better, and perhaps provide guidance as to which climate models best approximate internal ocean variability on longer timescales.
References
K. Haustein, F.E. Otto, V. Venema, P. Jacobs, K. Cowtan, Z. Hausfather, R.G. Way, B. White, A. Subramanian, and A.P. Schurer, “A limited role for unforced internal variability in 20th century warming.”, Journal of Climate, 2019. http://dx.doi.org/10.1175/JCLI-D-18-0555.1
G.C. Hegerl, S. Brönnimann, A. Schurer, and T. Cowan, “The early 20th century warming: Anomalies, causes, and consequences”, Wiley Interdisciplinary Reviews: Climate Change, vol. 9, pp. e522, 2018. http://dx.doi.org/10.1002/wcc.522
M.E. Mann, B.A. Steinman, and S.K. Miller, “On forced temperature changes, internal variability, and the AMO”, Geophysical Research Letters, vol. 41, pp. 3211-3219, 2014. http://dx.doi.org/10.1002/2014GL059233
A. Clement, K. Bellomo, L.N. Murphy, M.A. Cane, T. Mauritsen, G. Radel, and B. Stevens, “The Atlantic Multidecadal Oscillation without a role for ocean circulation”, Science, vol. 350, pp. 320-324, 2015. http://dx.doi.org/10.1126/science.aab3980
M.B. Stolpe, I. Medhaug, and R. Knutti, “Contribution of Atlantic and Pacific Multidecadal Variability to Twentieth-Century Temperature Changes”, Journal of Climate, vol. 30, pp. 6279-6295, 2017. http://dx.doi.org/10.1175/JCLI-D-16-0803.1
M.G. Wyatt, and J.A. Curry, “Role for Eurasian Arctic shelf sea ice in a secularly varying hemispheric climate signal during the 20th century”, Climate Dynamics, vol. 42, pp. 2763-2782, 2013. http://dx.doi.org/10.1007/s00382-013-1950-2
R.M. Hoesly, S.J. Smith, L. Feng, Z. Klimont, G. Janssens-Maenhout, T. Pitkanen, J.J. Seibert, L. Vu, R.J. Andres, R.M. Bolt, T.C. Bond, L. Dawidowski, N. Kholod, J. Kurokawa, M. Li, L. Liu, Z. Lu, M.C.P. Moura, P.R. O'Rourke, and Q. Zhang, “Historical (1750–2014) anthropogenic emissions of reactive gases and aerosols from the Community Emissions Data System (CEDS)”, Geoscientific Model Development, vol. 11, pp. 369-408, 2018. http://dx.doi.org/10.5194/gmd-11-369-2018
C.E. Forest, “Inferred Net Aerosol Forcing Based on Historical Climate Changes: a Review”, Current Climate Change Reports, vol. 4, pp. 11-22, 2018. http://dx.doi.org/10.1007/s40641-018-0085-2
K. Cowtan, R. Rohde, and Z. Hausfather, “Evaluating biases in sea surface temperature records using coastal weather stations”, Quarterly Journal of the Royal Meteorological Society, vol. 144, pp. 670-681, 2018. http://dx.doi.org/10.1002/qj.3235
P.J. Gleckler, K. AchutaRao, J.M. Gregory, B.D. Santer, K.E. Taylor, and T.M.L. Wigley, “Krakatoa lives: The effect of volcanic eruptions on ocean heat content and thermal expansion”, Geophysical Research Letters, vol. 33, 2006. http://dx.doi.org/10.1029/2006GL026771
Job Title: Senior Manager, Policy and Advocacy Department: Policy Reports to: Vice President of Policy FLSA Category: Exempt Revised Date: June 6, 2019 POSITION MISSION: To achieve American Forests’ policy and advocacy goals, manage the day-to-day implementation of the organization’s policy program and develop and manage the day-to-day implementation
Enablon and American Forests Partner for Tree Plantings in Elmwood, IL With support from Chicago Region Trees Initiative, planting event restores elm trees, teaches community about commitment to urban canopy (Washington, DC) – American Forests, in its continued efforts to “Reforest America” through its Community ReLeaf program, partnered with
AMERICAN FORESTS STRIVES TO ADVANCE TREE EQUITY IN DETROITAMERICAN FORESTS AND DTE ENERGY FOUNDATION HOST DEEP ROOTS DETROIT, A SUSTAINABILITY TOUR & TASTING, EXPLORING THIS RESURGENT CITY’S INNOVATIVE GREENSPACE INITIATIVES AND ADVANCING TREE EQUITY FOR ALLDETROIT, May 31, 2019 – American Forests and sustainability partner DTE Energy Foundation will host
Urban forests and landscaping renew business and residential districts. If we could not prove it before, the Detroit Land Bank sale of 26 homes earlier this month in Detroit, Michigan, illustrates it perfectly.The Detroit Land Bank announced a sale of over two dozen houses below market value — at $1,000


