For over a century, American Forests has been a leader in promoting urban tree canopy for the health, sustainability, and livability of cities. Urban forests should be a central part of every city’s plans and investments, and at American Forests, we lead a bipartisan effort to make forest restoration
Guest post by Matteo Willeit, Potsdam Institute for Climate Impact Research
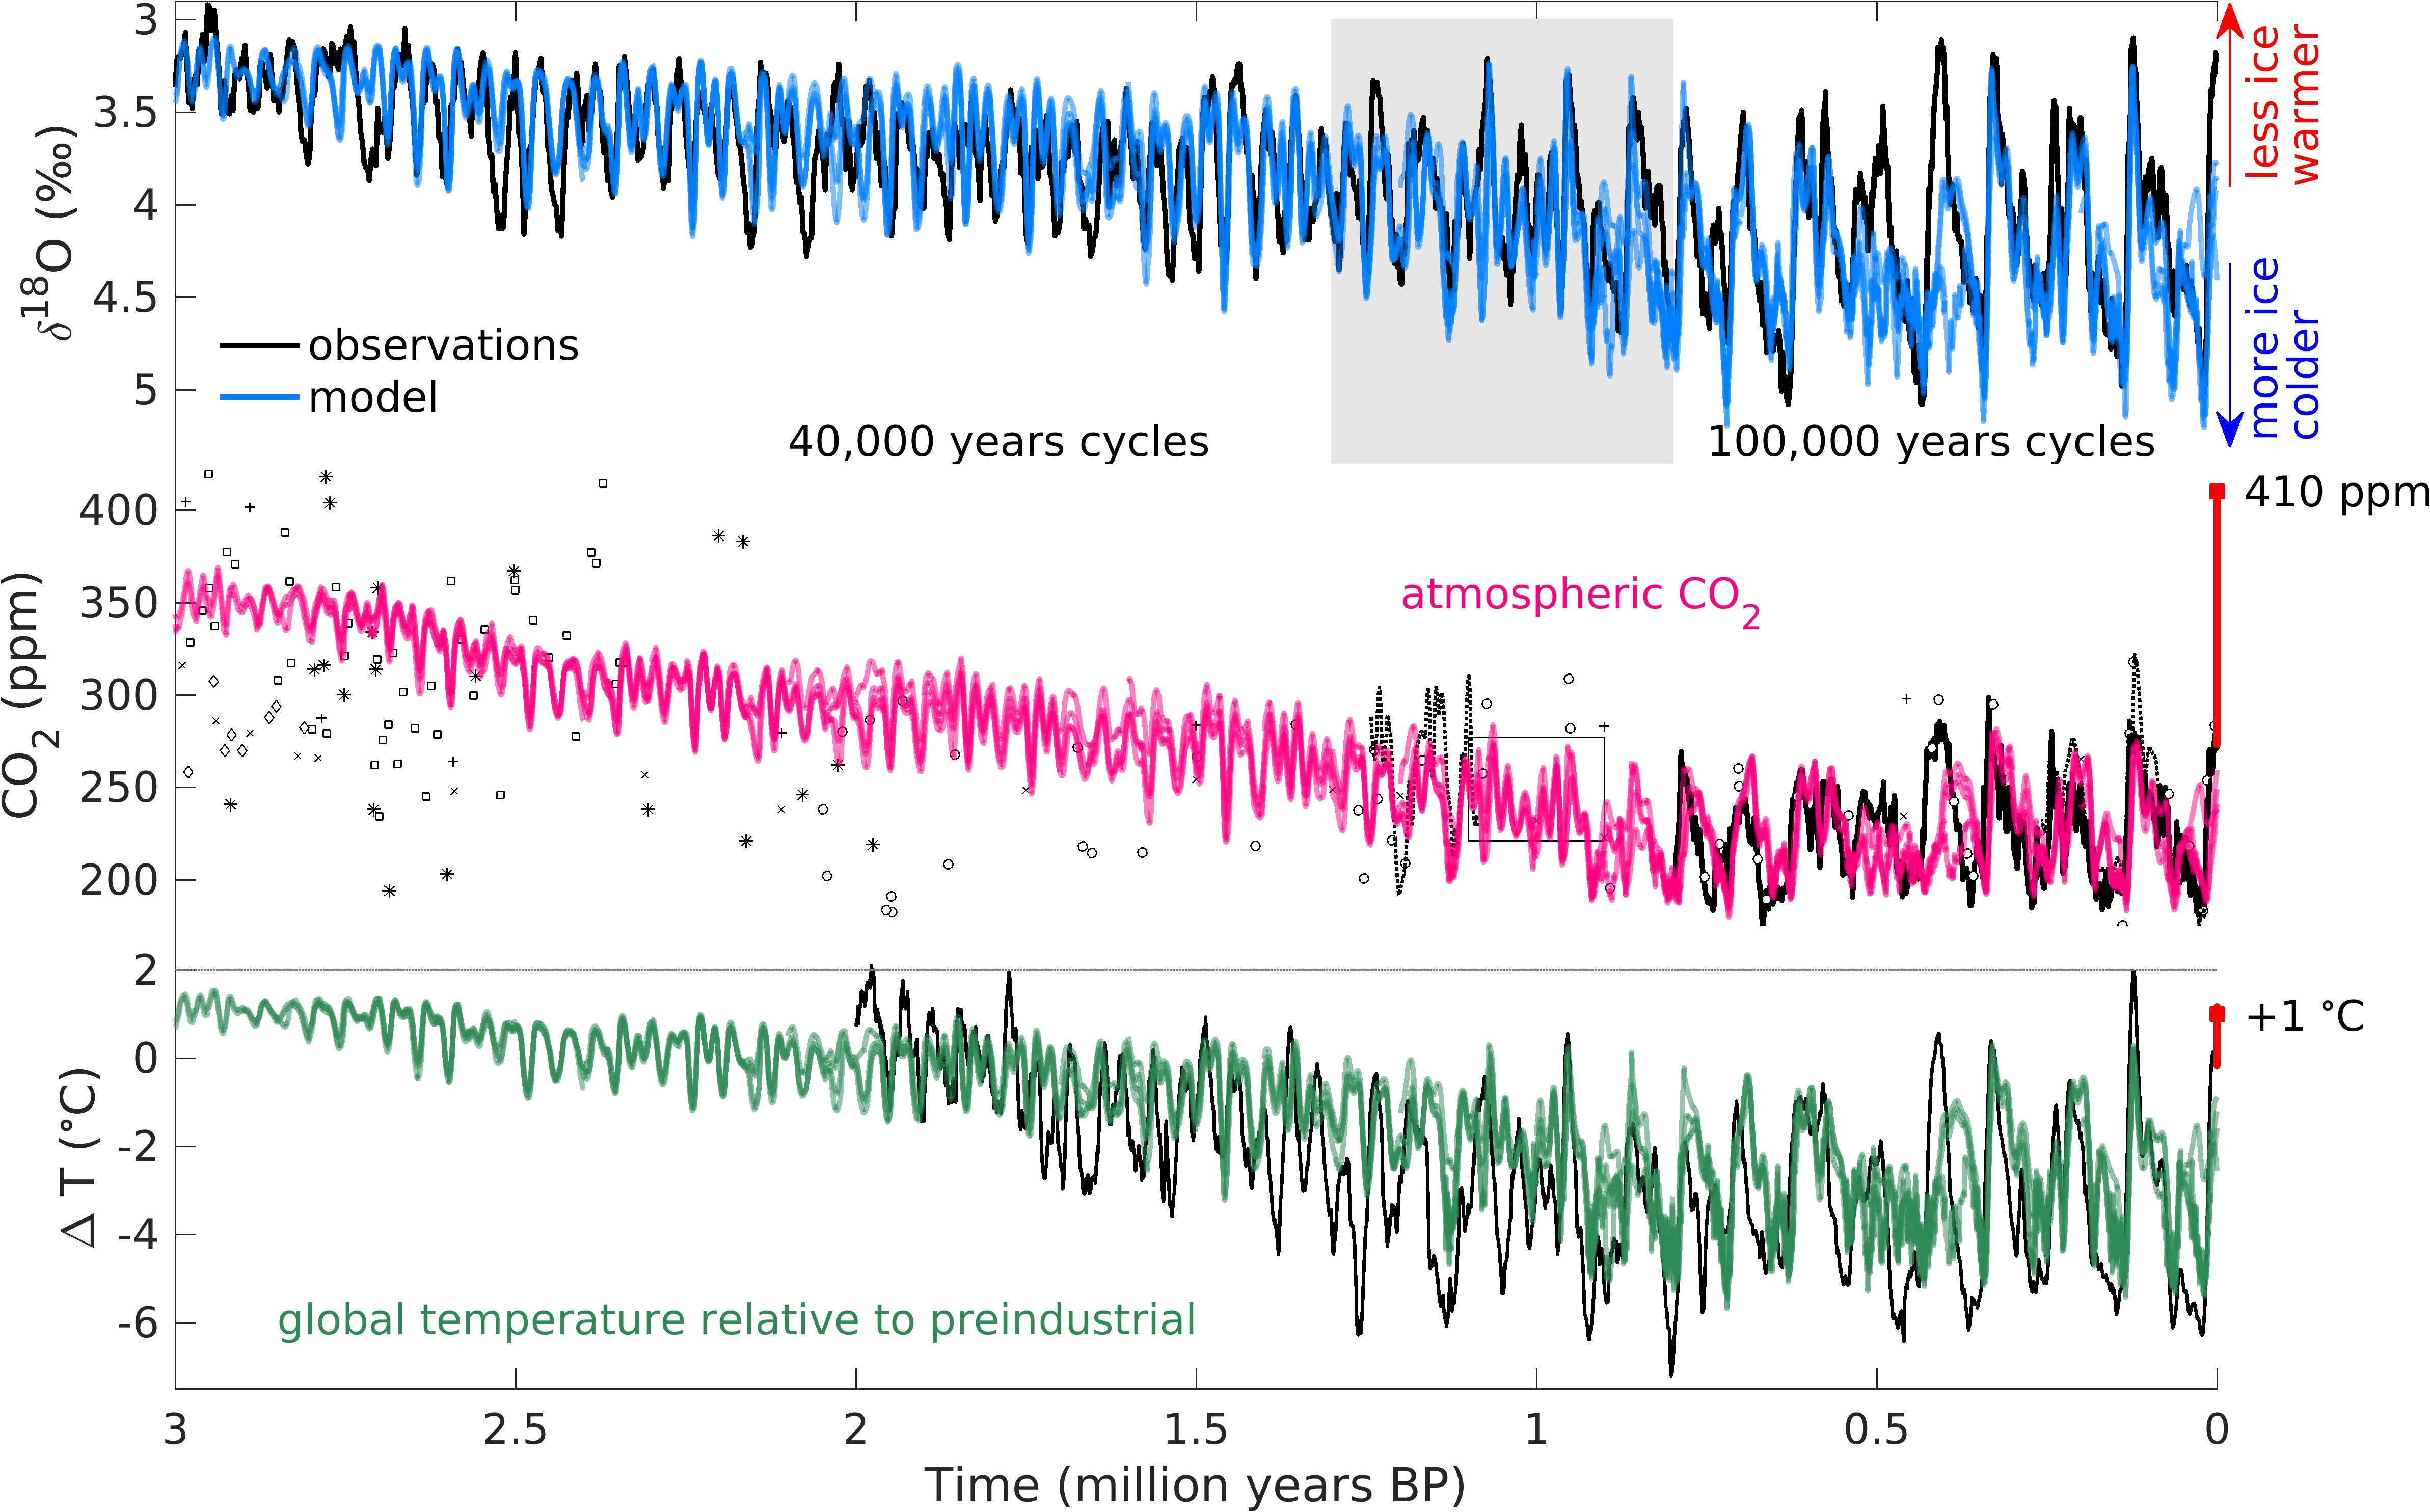
A new study published in Science Advances shows that the main features of natural climate variability over the last 3 million years can be reproduced with an efficient model of the Earth system.
The
Quaternary is the most recent geological Period, covering the past ~2.6 million
years. It is defined by the presence of glacial-interglacial cycles associated
with the cyclic growth and decay of continental ice sheets in the Northern
Hemisphere. Climate variations
during the Quaternary are best seen in oxygen isotopes measured in deep-sea sediment cores, which represent variations in global ice
volume and ocean temperature. These data show clearly that there has been a general trend towards
larger ice sheets and cooler temperatures over the last 3 million years,
accompanied by an increase in the amplitude of glacial-interglacial variations
and a transition from mostly symmetry cycles with a periodicity of 40,000 years
to strongly asymmetric 100,000-year cycles at around 1 million years ago. However, the ultimate causes of these
transitions in glacial cycle dynamics remain debated.
Among
others, the role of CO2 changes in shaping Quaternary climate dynamics is not
yet fully understood, largely because of the poor observational constraints on
atmospheric CO2 concentrations for the time before 800,000 years BP, beyond the
period covered by high-quality ice core data.
In a paper published today in Science Advances (Williet et al., 2019), we were able to reproduce the natural climate variability of the whole Quaternary with an Earth system model of intermediate complexity. Besides ocean and atmosphere, the model includes interactive ice sheets for the Northern Hemisphere and a fully coupled global carbon cycle and was driven only by changes in orbital configuration and different scenarios for slowly varying boundary conditions, namely CO2 outgassing from volcanoes as a geologic source of CO2, and changes in sediment distribution over the continents.
The model simulations provide a self-consistent reconstruction of CO2, climate and ice sheets constrained by available observations, i.e. oxygen isotopes and reconstructions of sea surface temperature. The fact that the model can reproduce the main features of the observed climate history gives us confidence in our general understanding of how the climate system works and provides some constraints on the contribution of external forcings and internal feedbacks to climate variability.
Our results imply a strong sensitivity of the Earth system to relatively small variations in atmospheric CO2. A gradual decrease of CO2 to values below ~350 ppm led to the start of continental ice sheet growth over Greenland and more generally over the NH at the end of the Pliocene, beginning of Pleistocene. Subsequently, the waxing and waning of the ice sheets acted to gradually remove the thick layer of unconsolidated sediments that had been formed previously over continents by the undisturbed action of weathering over millions of years. The erosion of this sediment layer – it was essentially bulldozed away by moving glaciers – affected the evolution of glacial cycles in several ways. First, ice sheets sitting on soft sediments are generally more mobile than ice sheets grounded on hard bedrock, because ice slides more easily over sediments compared to bedrock. Additionally, glacial sediment transport to the ice sheet margins generates substantial amounts of dust that, once deposited on the ice sheet surface, increases melting of the ice sheets by lowering surface albedo. Our results show that the gradual increase in the area of exposed bedrock over time led to more stable ice sheets which were less responsive to orbital forcing and ultimately paved the way for the transition to 100,000 years cycles at around 1 million years ago.
The simulations further suggest that global temperature never exceeded the preindustrial value by more than 2°C during the Quaternary. Ice sheet evolution is very sensitive to temperature, and the initiation of NH glaciation at around 3 million years ago would not have been possible in the model if global temperature would have been higher than 2°C relative to preindustrial during the early Quaternary. Since the model has been shown to accurately reproduce the sea level variations over the last 400,000 years and also the spatial ice sheet distribution at the last glacial maximum (Ganopolski & Brovkin 2017), we are confident that the sensitivity of ice sheets to climate is well represented in the model.
Likewise, our results indicate that the current CO2 concentration of ~410 ppm is unprecedented over the past 3 million years. The climate sensitivity of the model is around 3°C global warming for a doubling of CO2 concentration, which is at the center of the range of current best estimates of climate sensitivity that range between 1.5 and 4.5°C. It is possible that the real climate sensitivity is lower than 3°C, in which case the modelled CO2 concentration needed to fit the oxygen isotope record during the early Quaternary would be higher than in the present model simulations, but it would still be unlikely to exceed the present day value. In the context of future climate change, our results imply that a failure to significantly reduce CO2 emissions to comply with the Paris Agreement target of limiting global warming well below 2°C will not only bring Earth’s climate away from Holocene-like conditions, but also push it beyond climatic conditions experienced during the entire current geological period.
References
A. Ganopolski, and V. Brovkin, “Simulation of climate, ice sheets and CO<sub>2</sub> evolution during the last four glacial cycles with an Earth system model of intermediate complexity”, Climate of the Past, vol. 13, pp. 1695-1716, 2017. http://dx.doi.org/10.5194/cp-13-1695-2017
We cannot solve climate change without forests to help capture and store carbon dioxide (CO2) emissions made by humans. Forests absorb up to a third of carbon dioxide, the main greenhouse gas responsible for the planet’s warming. So planting more trees affords us more of a chance to deepen
Job Title: Database Manager Department: Development Reports to: Vice President of Philanthropy FLSA Category: Non-exempt Updated: March 2019 – SUMMARY: The Database Manager serves as the primary steward of the organization’s fundraising database and plays a critical role in its oversight and ensuring data integrity. The
RE: From NPR “Study Finds Racial Gap Between Who Causes Air Pollution And Who Breathes It” – American Forests Responds Who gets the privilege to breathe clean air? Do those who breathe cleaner air contribute more or less to air pollution? According to a recent study, inequity exists not
Preliminary data reported from the reference glaciers of the World Glacier Monitoring Service (WGMS) in 2018 from Argentina, Austria, China, France, Italy, Kazakhstan, Kyrgyzstan, Nepal, Norway, Russia, Sweden, Switzerland and United States indicate that 2018 will be the 30th consecutive year of significant negative annual balance (> -200mm); with a mean balance of -1247 mm for the 25 reporting reference glaciers, with only one glacier reporting a positive mass balance (WGMS, 2018).
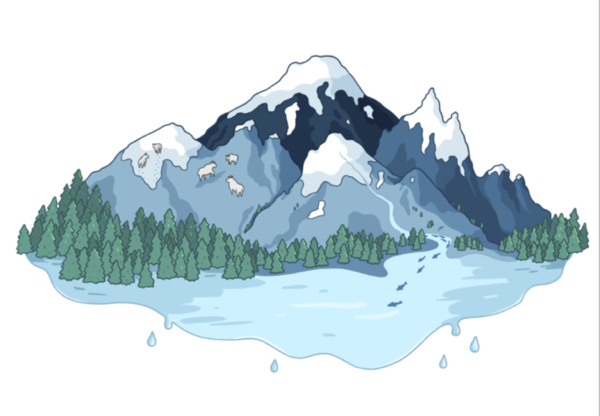
A view of how alpine glaciers in the Pacific Northwest fit into the broader ecosystem (Megan Pelto, Jill Pelto).
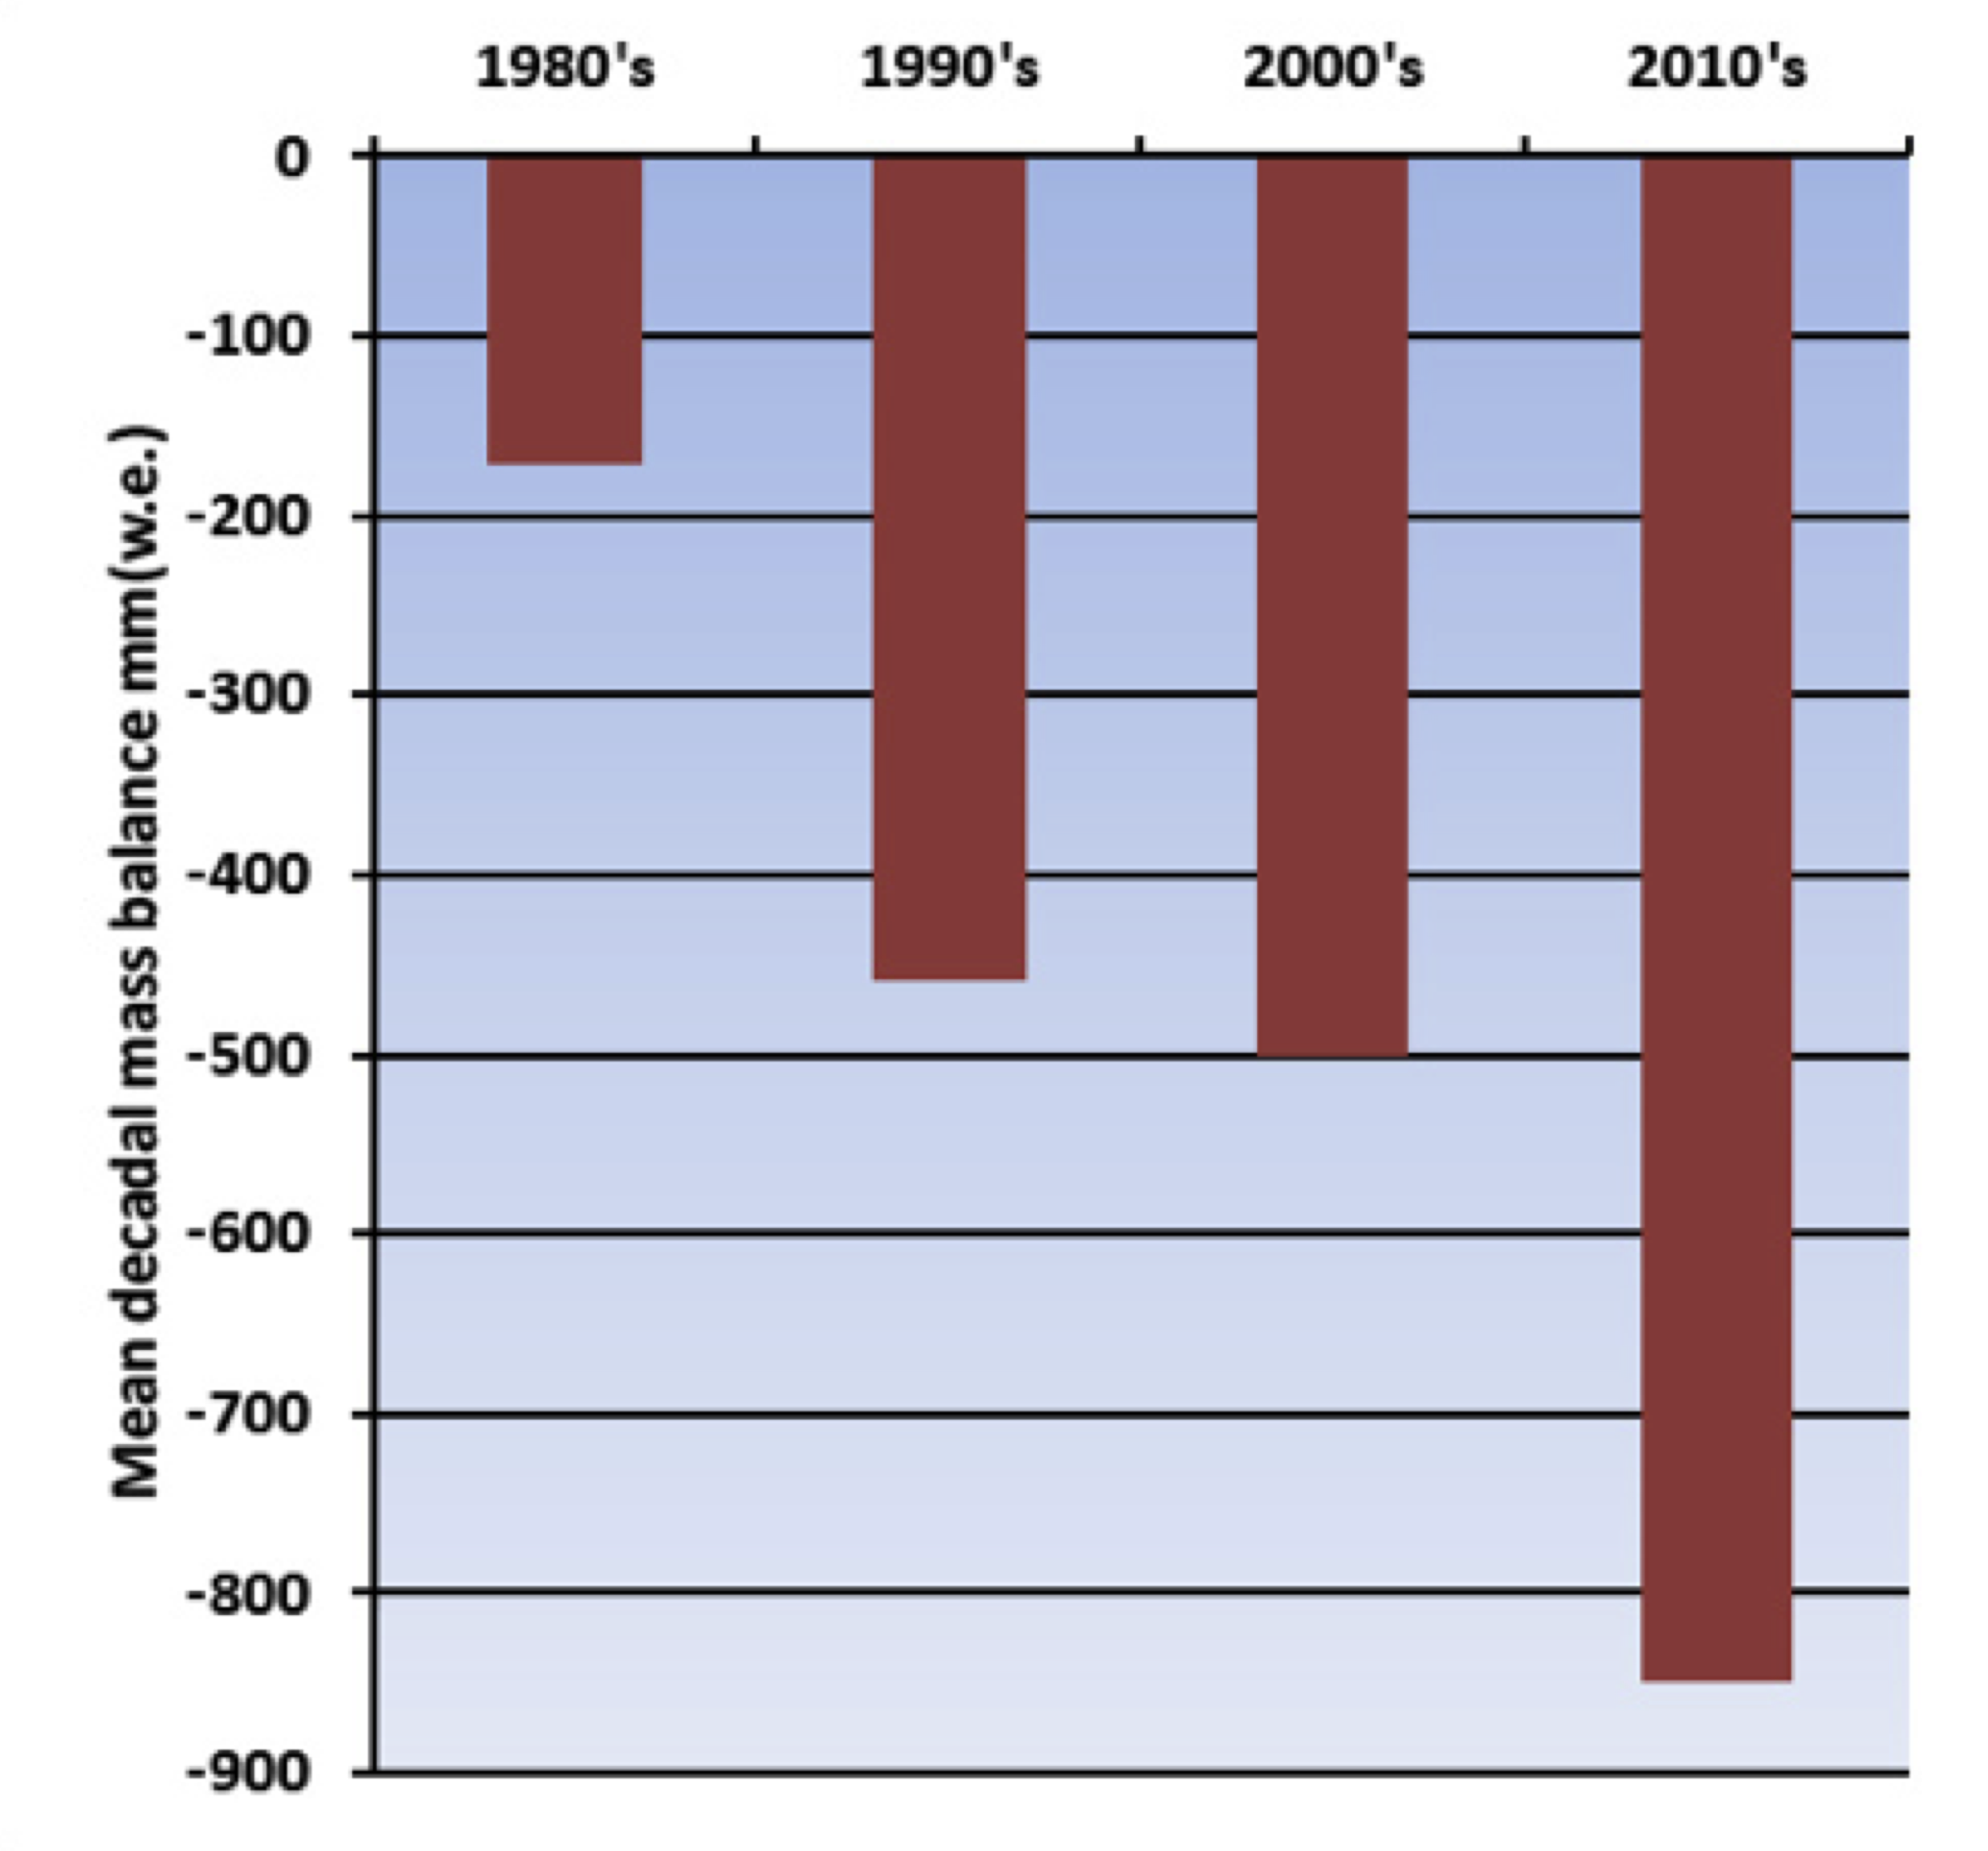
I have spent 35 consecutive summers measuring mass balance on alpine glaciers, and more than 750 nights in a tent to record their response to climate change. A decade ago I described what was happening to alpine glaciers here at RC, but the continued signal of mass loss is inescapable and has been getting worse. The decadal mean annual mass balance of WGMS reference alpine glaciers was -171 mm in the 1980’s, -460 mm in the 1990’s, -500 mm for 2000’s and – 850 mm for 2010-2018.
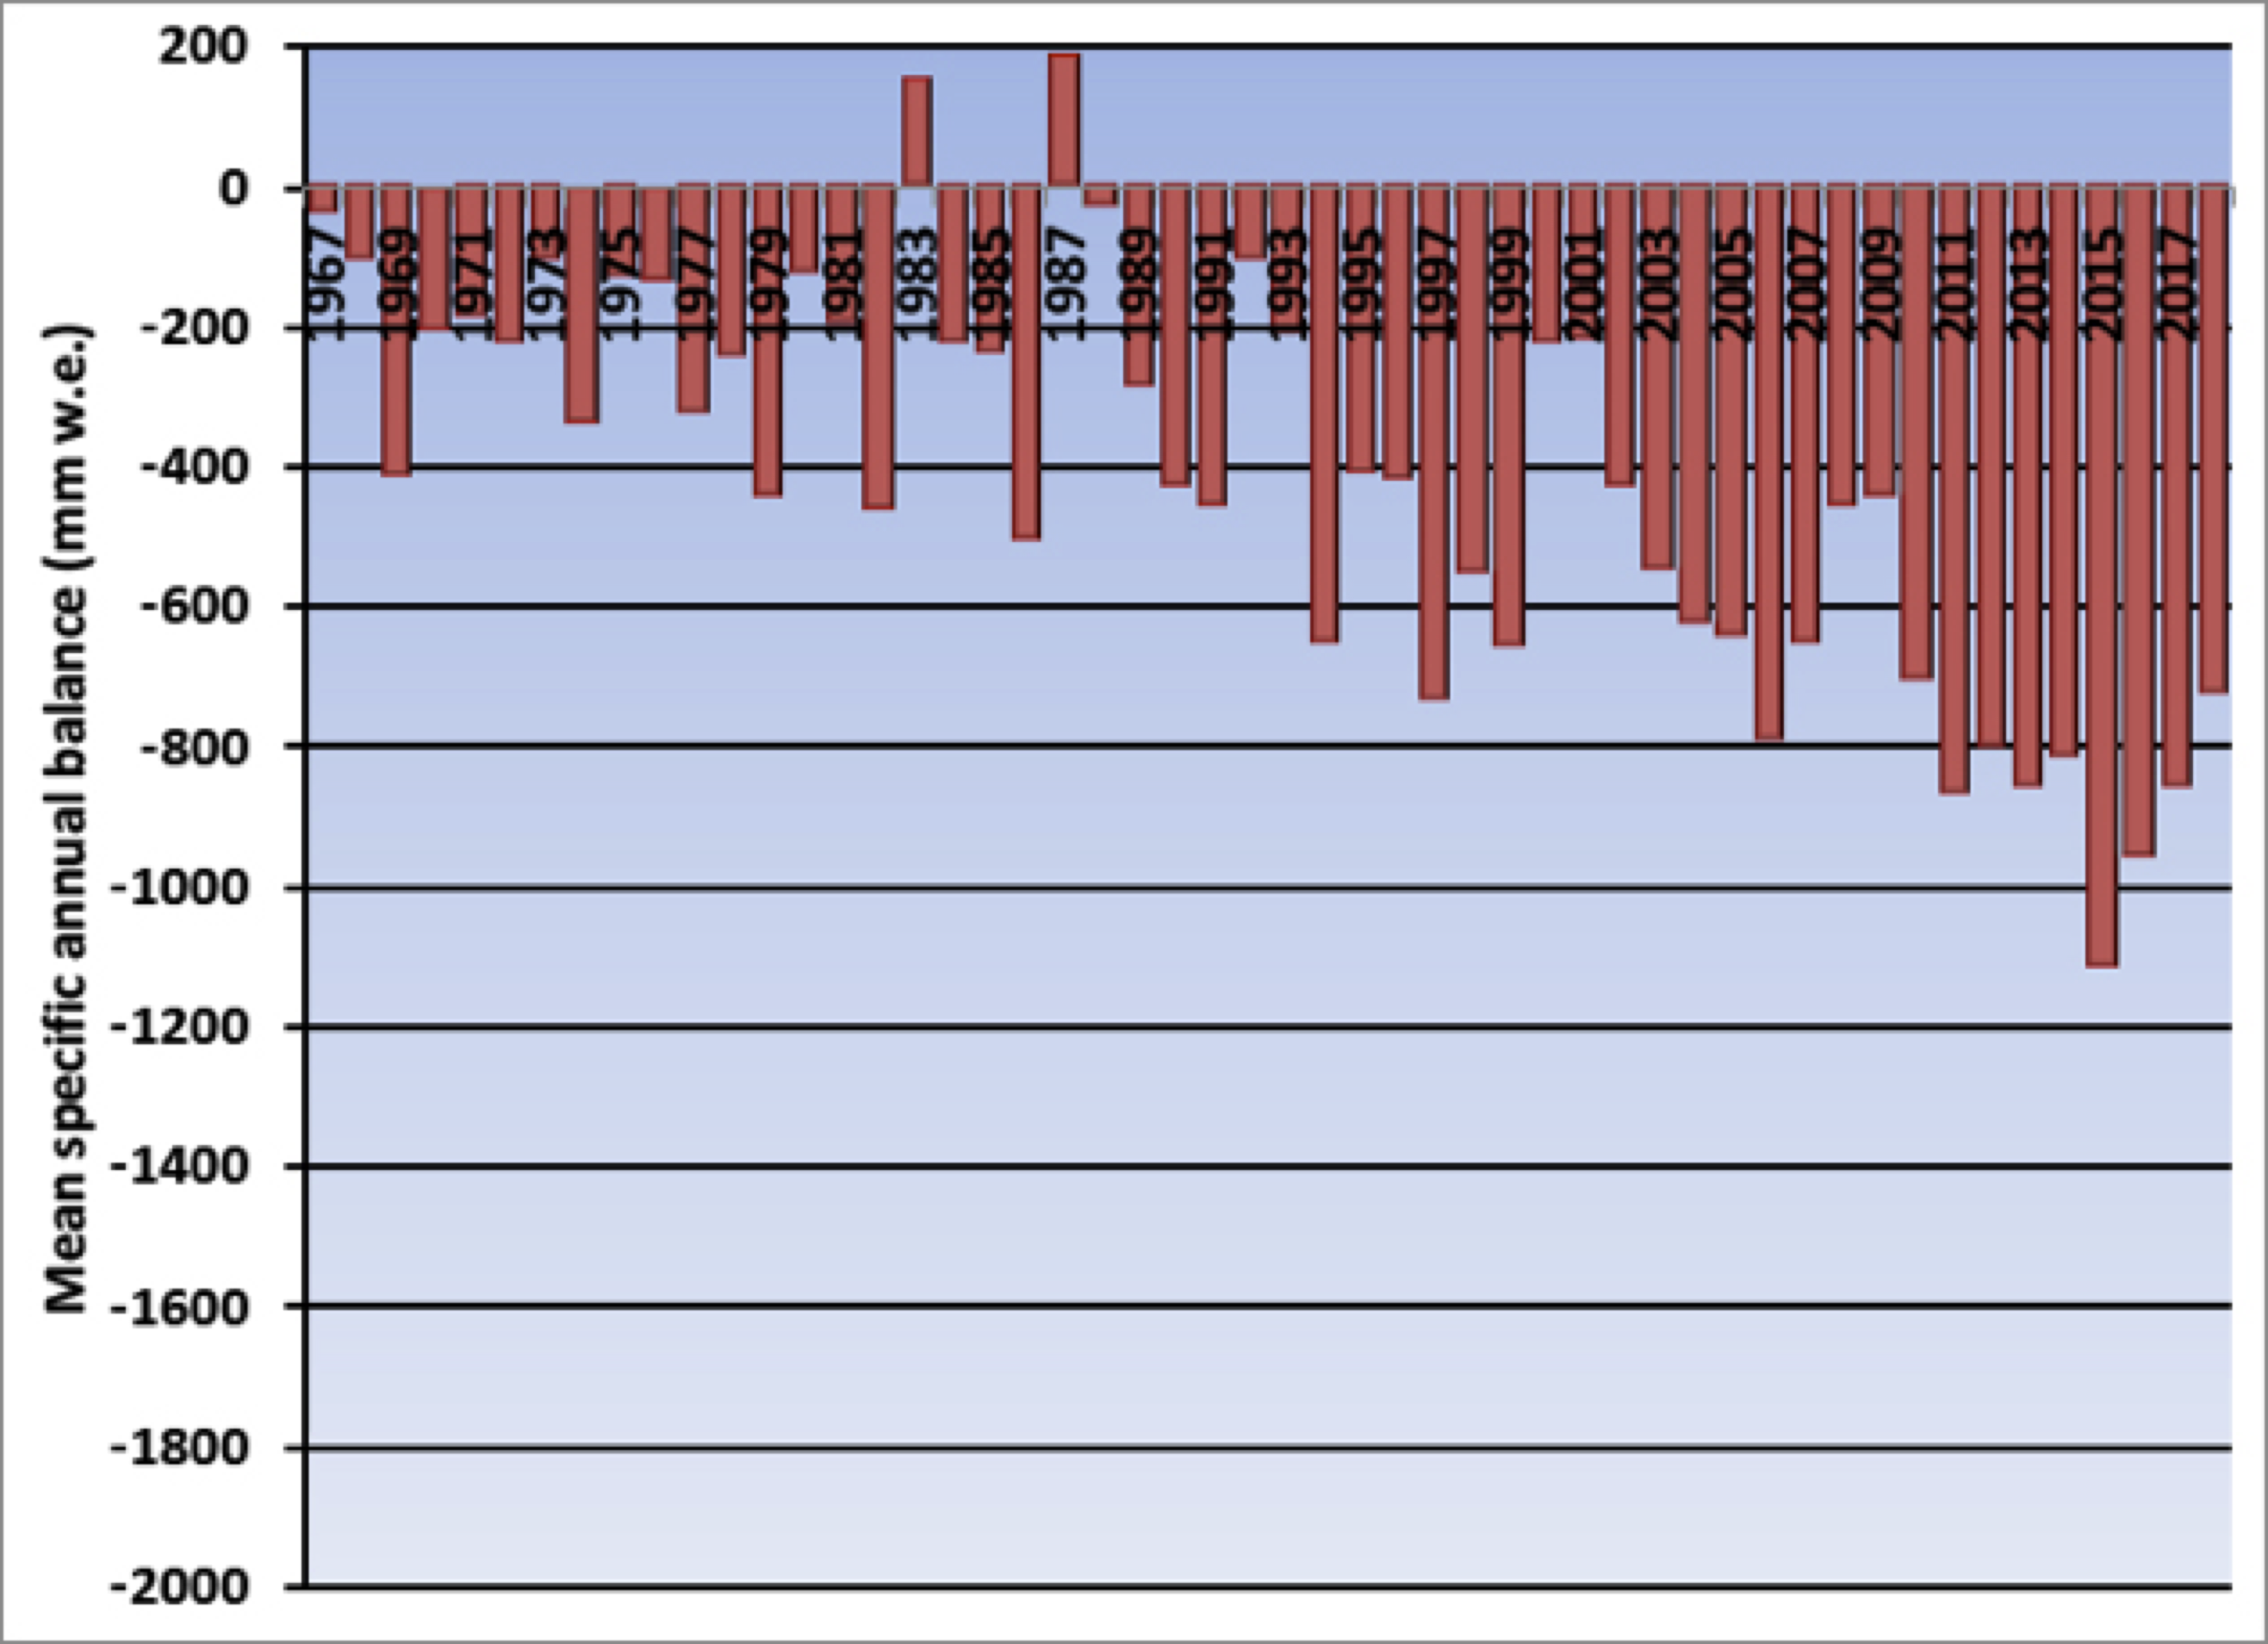
Figure 1. Global Alpine glacier annual mass balance record of reference glaciers submitted to the World Glacier Monitoring Service, with a minimum of 30 reporting glaciers. Global values are calculated using only one single value (averaged) for each of 19 mountain regions in order to avoid a bias to well observed regions.
Just as people need to consume as many calories as the expend or they will lose mass, glaciers need to accumulate as much snow and ice as is lost to melt and calving icebergs in order to survive. After 30 consecutive years of alpine glacier mass loss it is clear that the “diet/lifestyle” of alpine glaciers is not healthy and as the climate they live in changes, alpine glaciers will continue a downward health spiral.
Alpine glaciers are recognized as one of most sensitive indicators of climate change. WGMS record of mass balance and terminus behavior (WGMS, 2017) providing a global index for alpine glacier behavior. This record illustrates a consistent signal from alpine glaciers around the world of significant mass loss and consequent retreat. Glacier mass balance is the difference between accumulation and ablation, reported here in mm of water equivalence (mm). Mean annual glacier mass balance in 2017 was -921 mm for the 42 long term reference glaciers and -951 mm for all 142 monitored glaciers. Figure 1 and 2 are graphs of global glacier mass change showing the annual balance for a set of global reference glaciers with more than 30 continued observation years for the time-period 1950-2018.
Figure 2. Decadal average mass balance of WGMS reference glaciers.
Glacier retreat reflects sustained negative mass balances over the last 30 years (Zemp et al., 2015). The increasing rate of glacier mass loss during a period of retreat indicates alpine glaciers are not approaching equilibrium and retreat will continue to be the dominant terminus response (Pelto, 2018). Ongoing global glacier retreat is currently affecting human society by increasing the rate of sea-level rise, changing seasonal discharge in glacier fed rivers, and increasing geo-hazard potential (Huss et al, 2017) (pdf). The recent mass losses 1991-2010 are due to anthropogenic forcing (Marzeion et al. 2014).
The cumulative mass balance from 1980-2018 is -21.7 m, the equivalent of cutting a 24 m thick slice off the top of the average glacier (Figure 1). The trend is remarkably consistent across regions (WGMS, 2017). WGMS mass balance from 42 reference glaciers, which have a minimum 30 years of record, is not appreciably different from that of all monitored glaciers at -21.5 m.
The number of reference glaciers is small compared to the total number of alpine glaciers (~200,000) in the world, but has proved to be a good approximation of global alpine glacier change. Marzeion et al (2017) compared WGMS direct observations of mass balance on a few glaciers to both remote sensing mass balance calculations based all alpine glaciers over the shorter period of available satellite data and climate driven mass balance model calculations and found that each method yields reconcilable estimates relative to each other and fall within their respective uncertainty margins. The WGMS record appears to have a slight negative bias compared to modeling and remote sensing approaches, but this bias has been much reduced with the regionalized approach now used by WGMS.
In 2018 exceptional glacier melt was noted across the European Alps, leading to high snowlines and contributing to large negative mass balance of glaciers. In the European Alps, annual mass balance has been reported from 17 glaciers in Austria, France, Italy and Switzerland. All 17 had negative annual balances, with 15 exceeding -1000 mm with a mean of -1640 mm. This continues the pattern of substantial negative balances in the Alps, which will equate to further terminus retreat. Of 81 observed glaciers in 2017 in Switzerland, 80 retreated, and only 1 was stable (Huss et al, 2018, [Fr]). In 2017, 83 glaciers were observed in Austria,; 82 retreated, and again only one was stable. Mean terminus retreat was 25 m, the highest observed since 1960 when mean length change reporting began (Lieb and Kellerer-Pirklbauer, 2018).
In Norway and Sweden, mass balance surveys with completed results are available for eight glaciers; all had negative mass balances with an average loss of -1420 mm w.e. All 25 glaciers with terminus observations during the 2007-2017 period have retreated (Kjøllmoen et al, 2018).
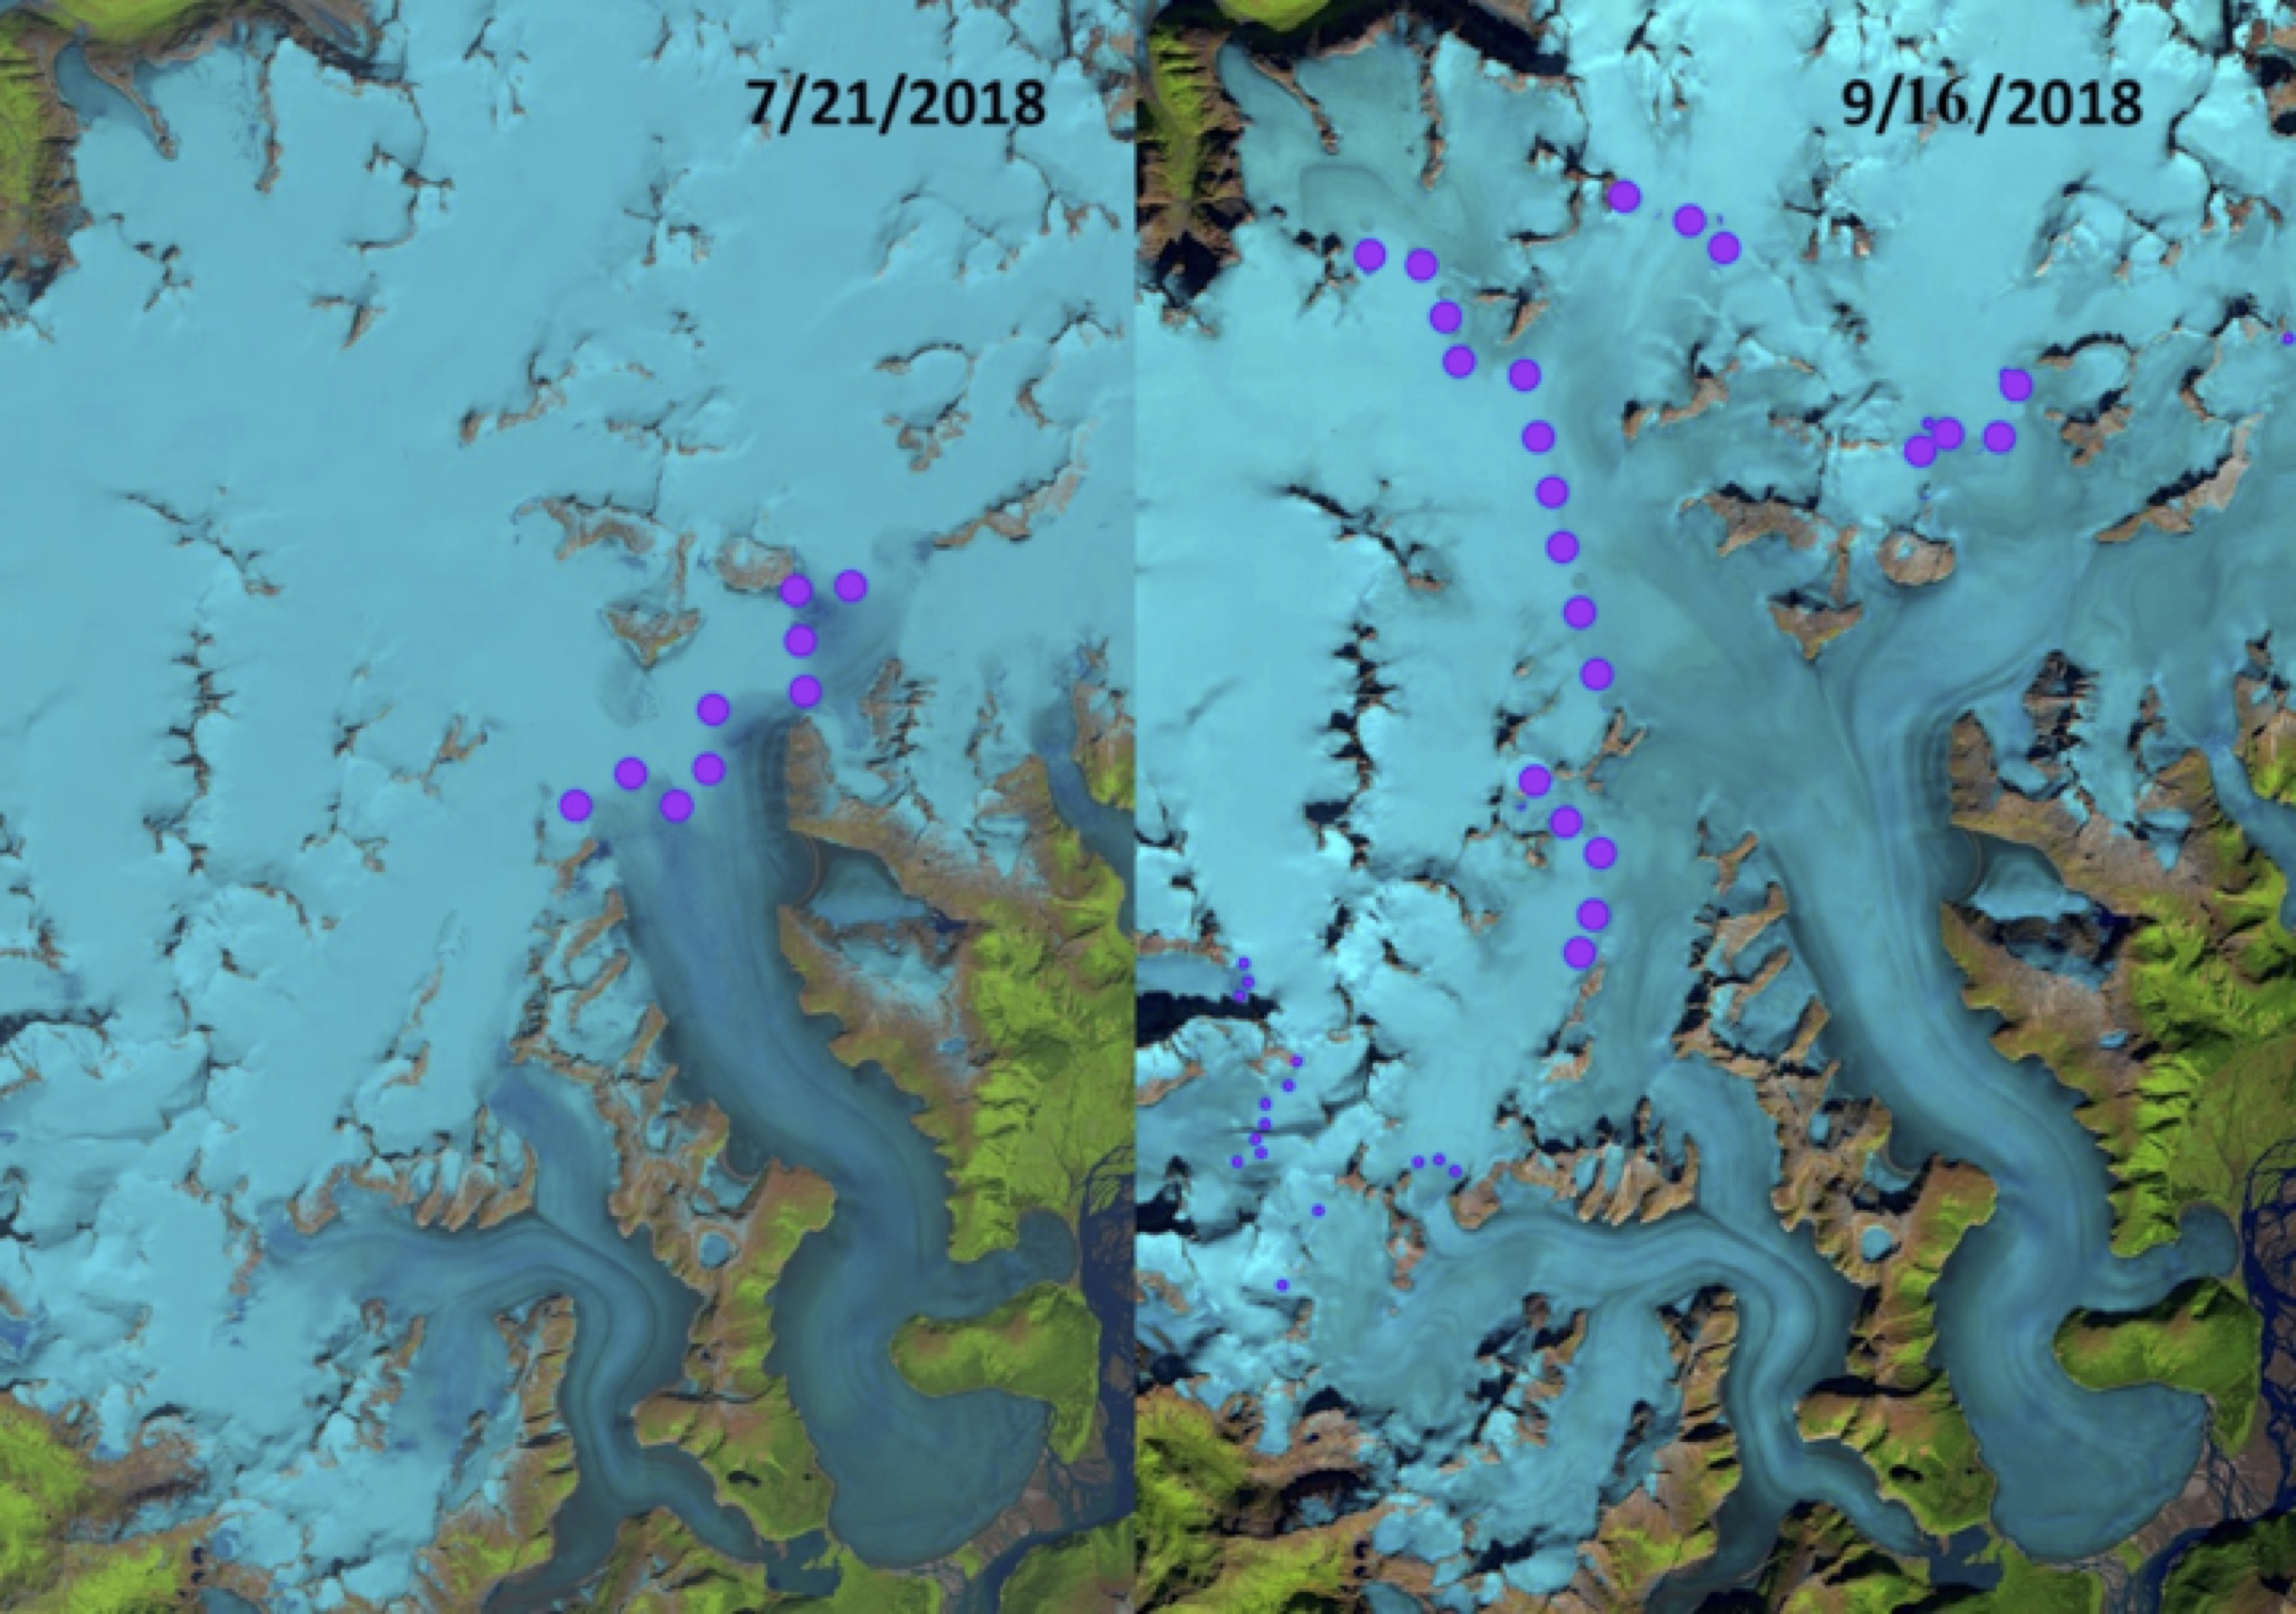
Figure 3. Taku Glacier transient snowline in Landsat 8 images from July 21, 2018 and September 16, 2018. The July 21 snowline is at 975 m and the September 16 snowline is at 1400 m. The average end of summer snowline from is m with the 2018 snowline being the highest observed since observations began in 1946.
In western North America data has been submitted from 11 glaciers in Alaska and Washington in the United States. All eleven glaciers reported negative mass balances with a mean loss of -870 mm. The longest mass balance record in North America is from Taku Glacier in Alaska. In 2018 the glacier had its most negative mass balance since the beginning of the record in 1946 and the highest end of summer snowline elevation at 1400 m. The North Cascade Range, Washington from 2014-2018 had the most negative five-year period for the region of the 1980-2018 WGMS record.
In the High Mountains of Asia (HMA) data was reported from ten glaciers including from China, Kazakhstan, Kyrgyzstan and Nepal. Nine of the ten had negative balances with a mean of -710 mm. This is a continuation of regional mass loss that has driven thinning and a slowdown in glacier movement in 9 of 11 regions in HMA from 2000-2017 (Dehecq et al. 2018).
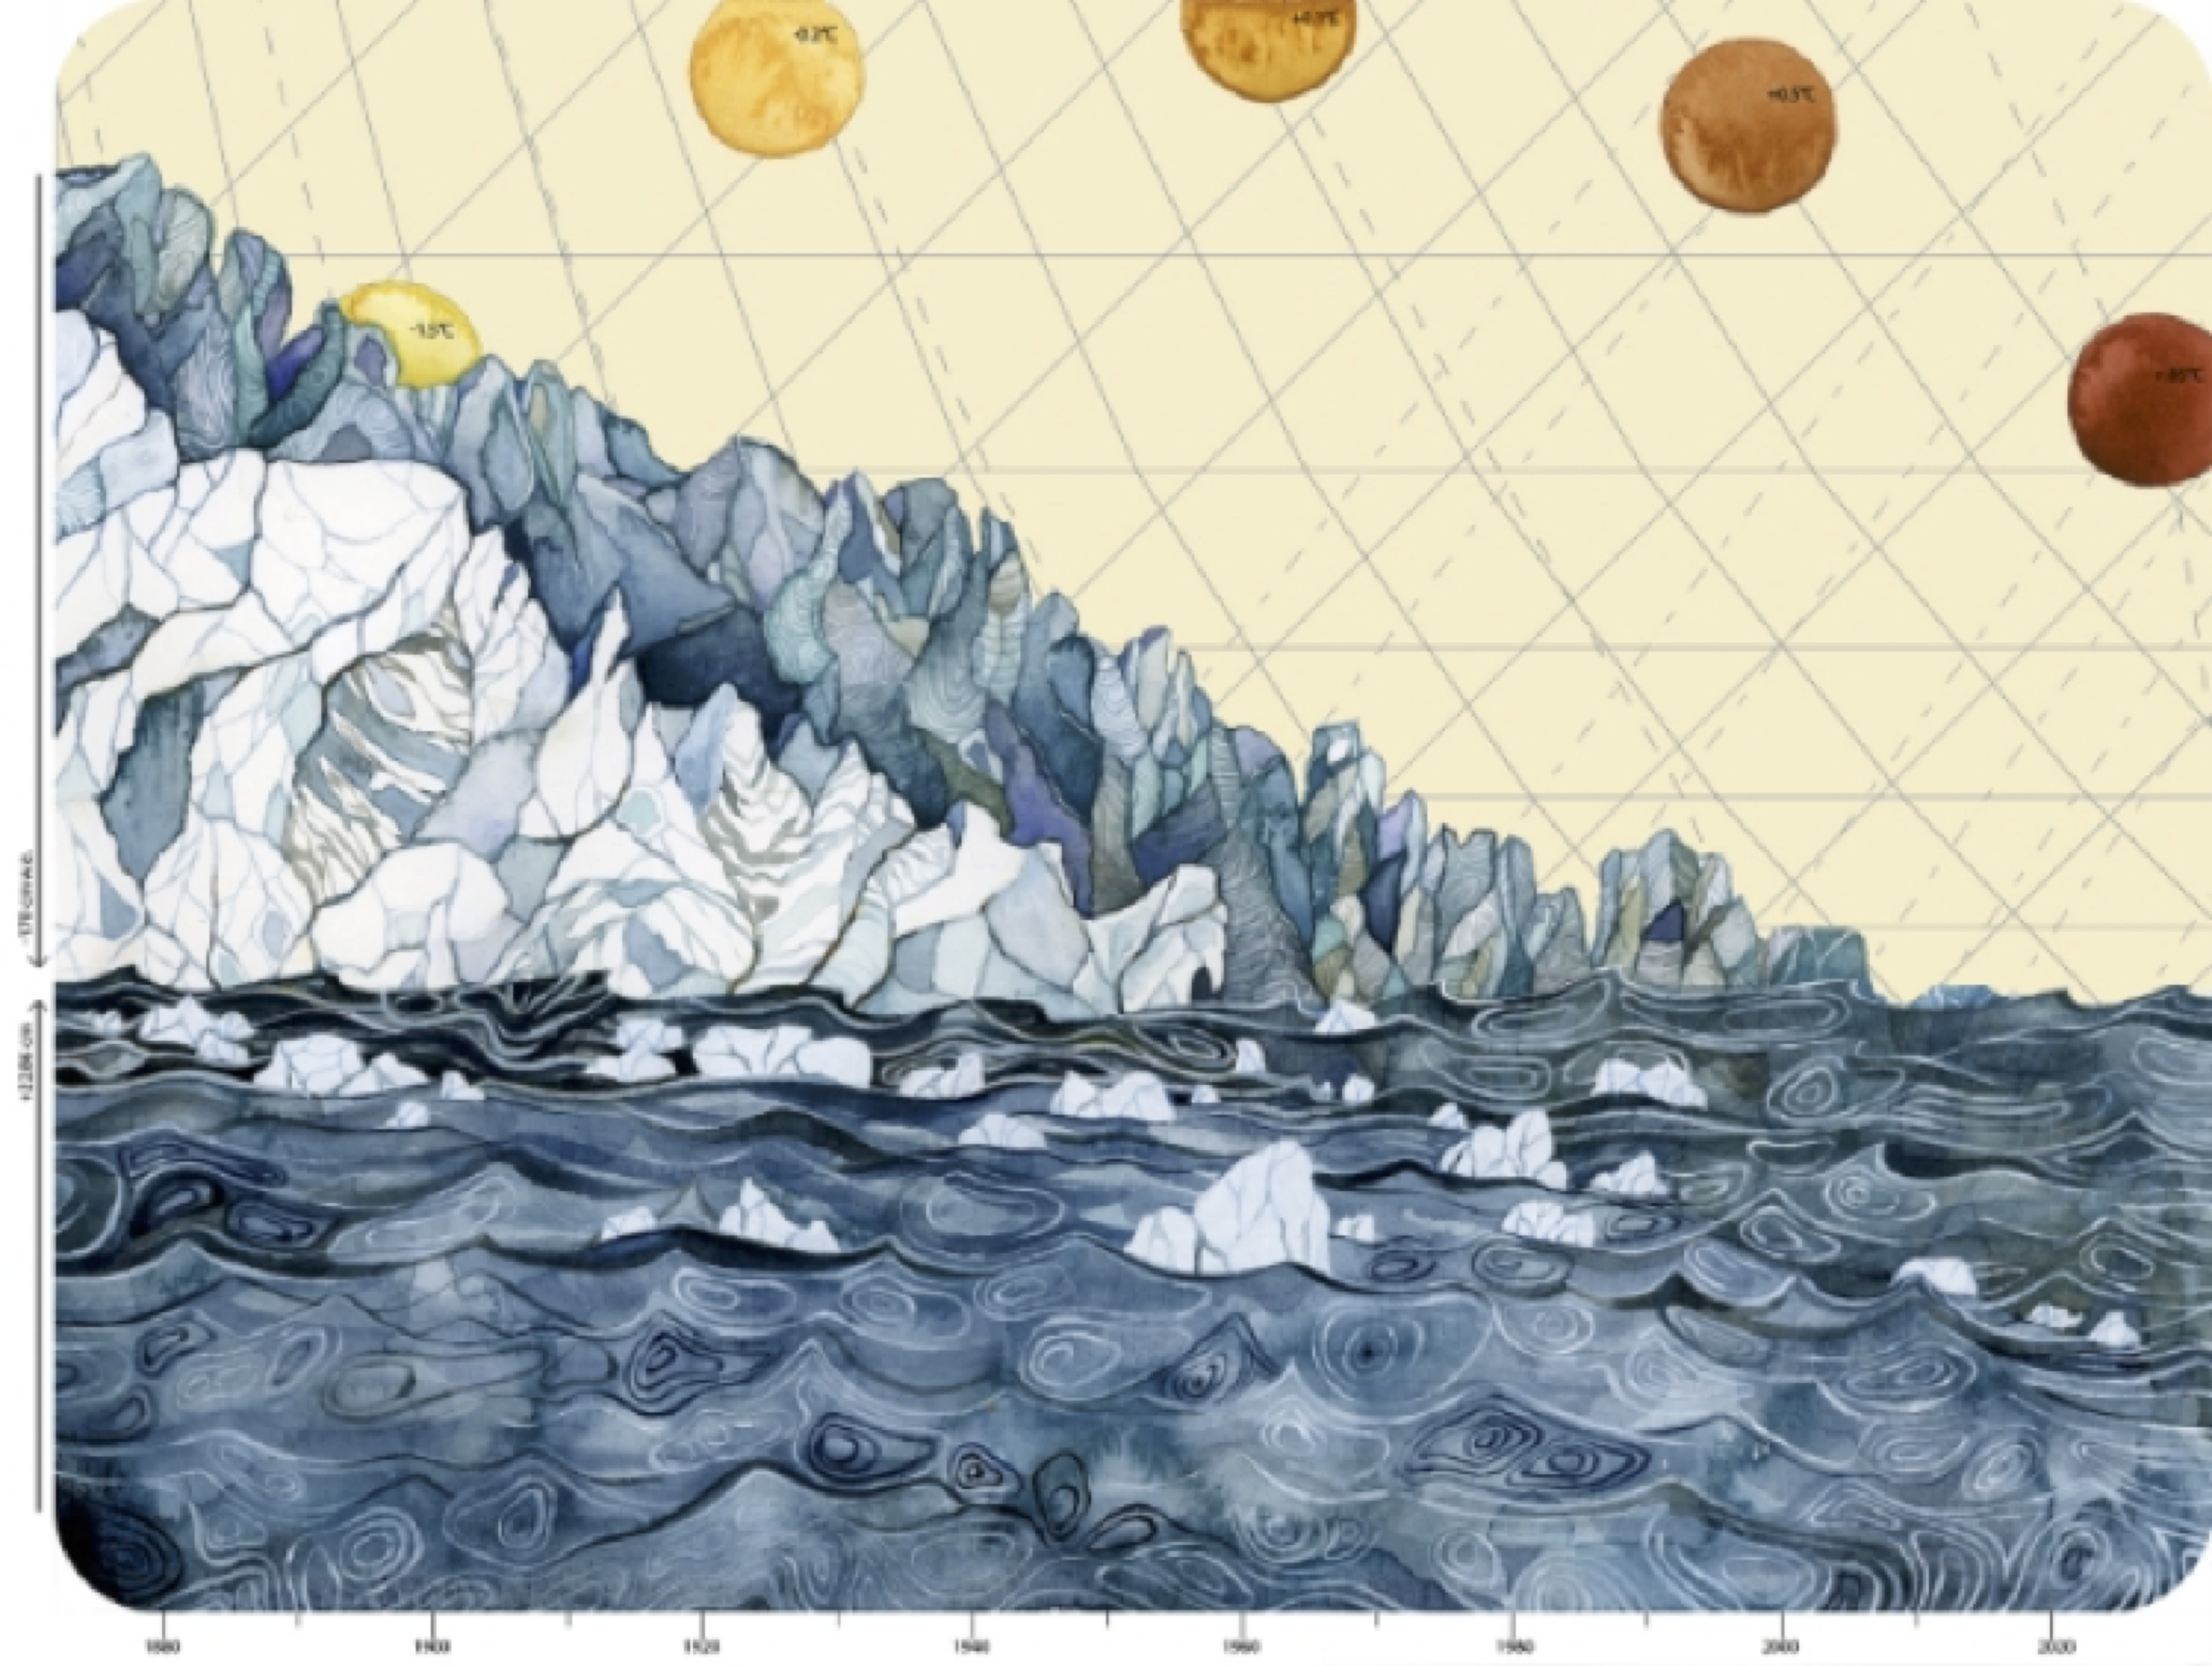
Time series of glacier mass balance and temperature (as rendered by J. Pelto).
The key take away is the same for alpine glaciers around the globe, warming temperatures lead to mass balance losses, which leads to velocity slow down. Mass balance is the key driver in glacier response, and a sustained negative mass balance leads to thinning and retreat, which leads to a glacier velocity decline, whether the glacier is in the Himalayas, Alps or Andes.
References
M. Zemp, H. Frey, I. Gärtner-Roer, S.U. Nussbaumer, M. Hoelzle, F. Paul, W. Haeberli, F. Denzinger, A.P. Ahlstrøm, B. Anderson, S. Bajracharya, C. Baroni, L.N. Braun, B.E. Cáceres, G. Casassa, G. Cobos, L.R. Dávila, H. Delgado Granados, M.N. Demuth, L. Espizua, A. Fischer, K. Fujita, B. Gadek, A. Ghazanfar, J. Ove Hagen, P. Holmlund, N. Karimi, Z. Li, M. Pelto, P. Pitte, V.V. Popovnin, C.A. Portocarrero, R. Prinz, C.V. Sangewar, I. Severskiy, O. Sigurđsson, A. Soruco, R. Usubaliev, and C. Vincent, “Historically unprecedented global glacier decline in the early 21st
century”, Journal of Glaciology, vol. 61, pp. 745-762, 2015. http://dx.doi.org/10.3189/2015JoG15J017
M. Pelto, “How Unusual Was 2015 in the 1984–2015 Period of the North Cascade Glacier Annual Mass Balance?”, Water, vol. 10, pp. 543, 2018. http://dx.doi.org/10.3390/w10050543
M. Huss, B. Bookhagen, C. Huggel, D. Jacobsen, R. Bradley, J. Clague, M. Vuille, W. Buytaert, D. Cayan, G. Greenwood, B. Mark, A. Milner, R. Weingartner, and M. Winder, “Toward mountains without permanent snow and ice”, Earth’s Future, vol. 5, pp. 418-435, 2017. http://dx.doi.org/10.1002/2016EF000514
B. Marzeion, J.G. Cogley, K. Richter, and D. Parkes, “Attribution of global glacier mass loss to anthropogenic and natural causes”, Science, vol. 345, pp. 919-921, 2014. http://dx.doi.org/10.1126/science.1254702
B. Marzeion, N. Champollion, W. Haeberli, K. Langley, P. Leclercq, and F. Paul, “Observation-Based Estimates of Global Glacier Mass Change and Its Contribution to Sea-Level Change”, Surveys in Geophysics, vol. 38, pp. 105-130, 2016. http://dx.doi.org/10.1007/s10712-016-9394-y
A. Dehecq, N. Gourmelen, A.S. Gardner, F. Brun, D. Goldberg, P.W. Nienow, E. Berthier, C. Vincent, P. Wagnon, and E. Trouvé, “Twenty-first century glacier slowdown driven by mass loss in High Mountain Asia”, Nature Geoscience, vol. 12, pp. 22-27, 2018. http://dx.doi.org/10.1038/s41561-018-0271-9
Job Title: Senior Manager, Lower Rio Grande Valley Restoration Department: American ReLeaf Reports to: Vice President of Landscape Conservation FLSA Category: Exempt Updated: March 21, 2019 – BACKGROUND: Native thornscrub forest once covered much of the Lower Rio Grande Valley, featuring dense and diverse
American Forests is proud to share an update from Brian Kelley, our Champion Tree Archivist. 2018 was a successful year, photographing and audio recording almost 70 Champion Trees listed on our National Register. He has been on the road, primarily in California. He recently visited our headquarters in Washington, DC
American Forests’ Statement on School Climate Strike Brave Youth Hold Worldwide School Strike to Call for Climate Action Across the world today, March 15, school students are rallying together to strike for climate change action. Starting with 150,000 strikers reported in Australia, these events are rippling across time zones and slated to begin in the