Jeffrey Pine (Pinus jeffreyi)

American Forests National Tree Register, Species: Jeffrey Pine (Pinus jeffreyi), State: CA
Description

Location Huntington Lake, CA

Jeffrey PINE

Pinus jeffreyi

This champion Jeffrey Pine of California made its debut on the list of American Forests Champion Trees in , as it is the largest known tree of its species in the country. By recognizing these champions, we recognize the beauty and critical ecosystem services provided by our biggest and oldest trees.

jQuery(window).load(function(){
jQuery(‘.bt_images_slider’).bxSlider({
mode: ‘fade’,
captions: false,
adaptiveHeight: true,
slideWidth: ‘auto’,
preloadImages: ‘all’,
pager: false,
controls: false,
nextSelector: ‘#bt_images_slider’,
auto: false,
speed: 0,
onSliderLoad: function(){
jQuery(‘#bt_images_slider’).css(‘visibility’, ‘visible’);
}
});
});

STATUS Champion
Tree circumference 298
height 184
crown spread 69
Total points 499

LOCATION Huntington Lake, CA
Nominated by
Year Nominated 2018
Date crowned

Other Champion Trees

Pinus albicaulis

Pinus lambertiana

Pinus ponderosa var. brachytera

Help us honor and protect our nation’s Champion Trees.

Ways to Engage

search-icon

Search

Search the American Forests Champion Tree national register.

Nominate

Nominate a big tree that you think can achieve champion status.

Explore

Browse stories on our blog, Loose Leaf, and get to know the people and champions that make up the program.

Subscribe

Sign up for our big tree email list and receive year-round updates on the program.

The post Jeffrey Pine (Pinus jeffreyi) appeared first on American Forests.

Walking for Future Generations

November 28th, 2018|Tags: , |

In August 2018, sixty-nine-year-old Bob McCormick decided to go for a long walk. The writer and activist is walking the 1,700 miles from his hometown of Denver to Washington, D.C., to draw attention to Intergenerational Justice, the idea that the current human population has a responsibility to future generations. Two hip replacements and a knee replacement aren’t keeping him from sharing his passion.

“The well-being of our children and all future humans is threatened by current human activity,” McCormick says. “Intergenerational Justice deserves a seat at the table when we are discussing how we will conduct our affairs, locally, nationally, and globally.”

Together, McCormick believes, we can shift the dire global predictions that are at the center of Intergenerational Justice. The health of our environment is among issues McCormick believes can be addressed.

Bob McCormick approaches the Colorado/Kansas border

Bob McCormick approaching the Colorado/Kansas border in mid-August.

“The key lesson is that while the spread of deforestation is linked with socio-economic development, controlling it may well depend on political development,” McCormick says regarding Intergenerational Justice. “How we treat our forests is critical to our future development.”

McCormick has persevered through heat and driving rain, walked alongside speeding trucks and dealt with suffering recurring injuries and broken equipment. The difficulties he has faced on his journey invites the question: Why is he still doing this?

In the simplest terms, McCormick says he tells people, “I’m walking for my great-grandchildren and for yours.”

Visit www.aWalkforChange.org for background, live tracking of McCormick’s progress, and to make donations to support the walk.

The post Walking for Future Generations appeared first on American Forests.

Forest Digest: November 25, 2018

November 25th, 2018|Tags: , |

Check out what’s going on in forest and environmental news this week!

U.S. impacts of climate change are intensifying, federal report says — USA Today

A report released on Friday states that Earth’s climate is now changing faster than at any point in the history of modern civilization. The report follows consecutive years of record-breaking catastrophic weather and gives a special focus to the U.S.

Bio jet fuels good for the climate, but technologies need tweaking — Phys.org

Norwegian researchers are studying how the use of biofuels can decrease or eliminate carbon emissions caused by air travel. Aviation emissions have long-term and short-term effects on the planet and biofuels must be created with that in mind.

Who is the We in “We Are Causing Climate Change”? — Slate

People say “we” are to blame for climate change. But in a world where 735 million people live on less than $2 a day and 5.5 billion people live on $2-$10 day, we can’t all be blamed equally. Ten percent of the global population produces 50 percent of global emissions every year. We can all do something about climate change, but feeling collectively guilty isn’t helping.

Volcanoes and glaciers combine as powerful methane producers — Science Daily

In Iceland, 41 metric tons of methane are released into the atmosphere each day through the meltwater of Sólheimajökull glacier. The glacier sits on top of an active, ice-covered volcano, and scientists are studying it in hopes it will shed light on whether such greenhouse gases are actually coming from glaciers.

Will We Survive Climate Change? — The New York Times

The analysis released by the IPCC in early October stirred up a flurry of conversation about climate change and the effects greenhouse gases are having (and will have) on our planet. And though things don’t look good at the moment, researchers think the human race can survive. “It’s worth pointing out there is no scientific support for inevitable doom,” one expert says.

The post Forest Digest: November 25, 2018 appeared first on American Forests.

4th National Climate Assessment report

In possibly the biggest “Friday night news dump” in climate report history, the long awaited 4th National Climate Assessment (#NCA4) was released today (roughly two weeks earlier than everyone had been expecting).

The summaries and FAQ (pdf) are good, and the ClimateNexus briefing is worth reading too. The basic picture is utterly unsurprising, but the real interest in the NCA is the detailed work on vulnerabilities and sectorial impacts in 10 specific regions of the US. The writing teams for those sections include a whole raft of scientists and local stakeholders and so if you think climate reports are the same old, same old, it’s where you should go to read things you might not have seen before.

Obviously, since the report was only released at 2pm today without any serious embargo, most takes you will read today or tomorrow will be pretty superficial, but there should be more considered discussions over the next few days. Feel free to ask specific questions or bring up topics below.

The long story of constraining ocean heat content

Scientists predicted in the 1980s that a key fingerprint of anthropogenic climate change would be found in the ocean. If they were correct that increases in greenhouse gases were changing how much heat was coming into the system, then the component with the biggest heat capacity, the oceans, is where most of that heat would end up.

We have now had almost two decades of attempts to characterize this change, but the path to confirming those predictions has been anything but smooth…

Predictions

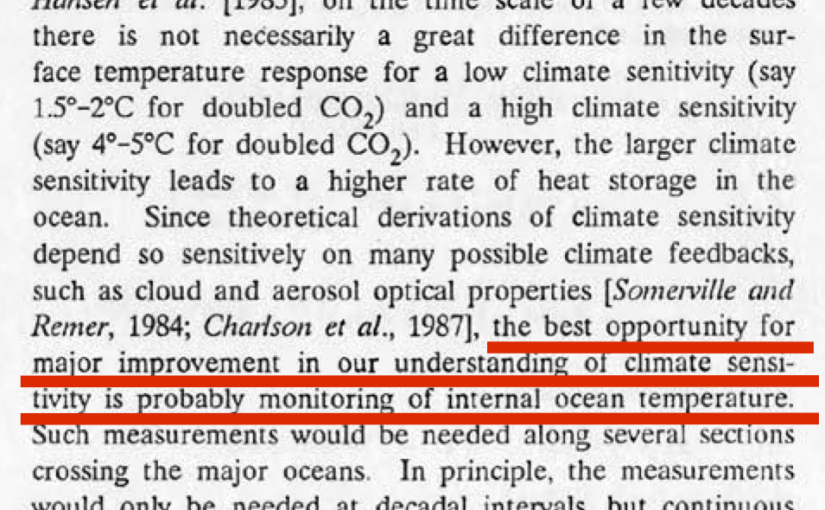
At least as far back as Hansen et al (1988), scientists realised the importance of characterizing the changes in ocean heat content as the key determinant of external driving of climate change as opposed to internal variability.

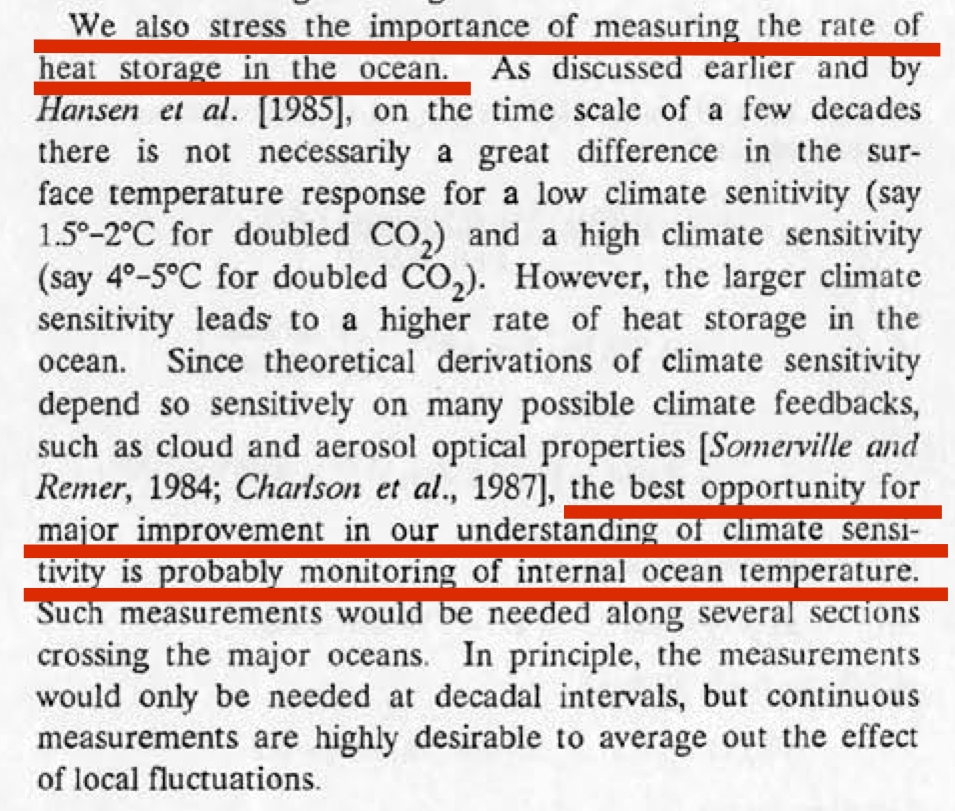
The key realisation was that for a very low sensitivity planet, there is not much adjustment required to ocean temperatures, and so that can happen quickly without a significant heat imbalance for very long. For a higher sensitivity planet, more changes in ocean temperatures are needed, and so more heat needs to go into the ocean and that requires a longer period with a significant imbalance. Tracking the imbalance therefore gives you leverage in figuring out sensitivity.

First attempts

The first global analysis of ocean heat content changes was a massive undertaking that needed to use a huge amount of the ocean ship data that was only just becoming available. It wasn’t achieved until Levitus et al. (2000) and covered the period 1950-1999. An update a few years later giving trends to 2003 confirmed the picture (Levitus et al, 2005):

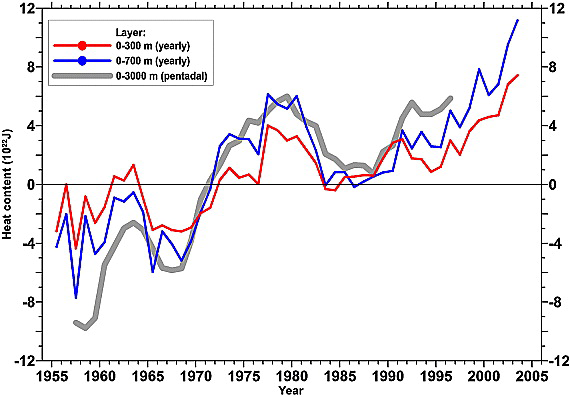
Figure 1: Levitus et al (2005)

But while these preliminary analyses did suggest that the oceans were warming (with a net heat input of a few tenths W/m2 averaged over the whole planet), there was a lot of quasi-decadal variability – more in fact, than people were expecting (for instance, the large excursion between 1970 and 1990). For a number of years this was a puzzle, because while models reproduced the long term trends, they didn’t match the decadal variance
(Barnett et al, 2005)
.

As with most model-observation discrepancies, people looked in multiple places for a resolution. Sampling was one obvious issue: was the sparse data, particularly in the early years and in the Southern Ocean, artificially increasing the variance in the data? That was looked at by AchtuaRao et al (2006), who found that yes, that was a factor, but no, it didn’t make up the whole difference. Others looked into whether the ocean models could be improved.

Corroboration and confusion

Meanwhile, other estimates of the OHC trend came from newer technologies, including the Argo floats (from ~2000 onward), and satellite altimetry (Willis et al, 2004) giving a 1993-2003 trend of 0.60 ± 0.10 W/m2, which did match the model trends for the more recent period (Hansen et al., 2005).


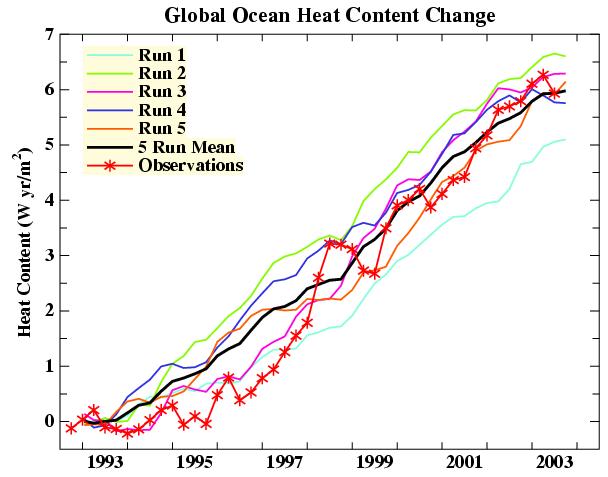
Figure 2. Hansen et al (2005)

However, as the Argo float network came to dominate the dataset (from 2003 or so), more oddities arose. For instance, it was reported that the oceans had dramatically cooled between 2003 and 2005 by Lyman and colleagues, only for the trends to be reversed a few months later once a pressure sensor error in some of the floats was revealed and corrected.

Other scientists turned up yet another problem, and that was with the XBT data that made up a varying part of the ocean data going back decades (Gouretski and Koltermann, 2007). Many of these “eXpendable Bathy-Thermographs” needed a new correction to their fall speeds so that their data was correctly set to the real depth where they were measuring.

With these corrections in hand, Levitus and colleagues updated their analysis in 2009:

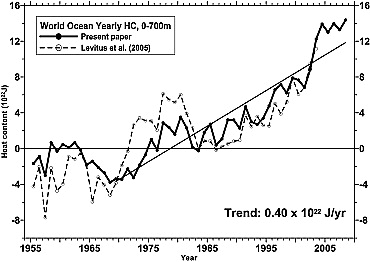
Figure 3. Levitus et al (2009)

Other groups also put together estimates of the changes, using different methodologies, different corrections and screenings of the data, and came up with (initially) quite different trends (though all showed the long term warming) i.e. Domingues et al. (2008) and Ishii and Kimoto (2009). Additionally, Lyman et al (2010) presented a new analysis using more of the Argo data:


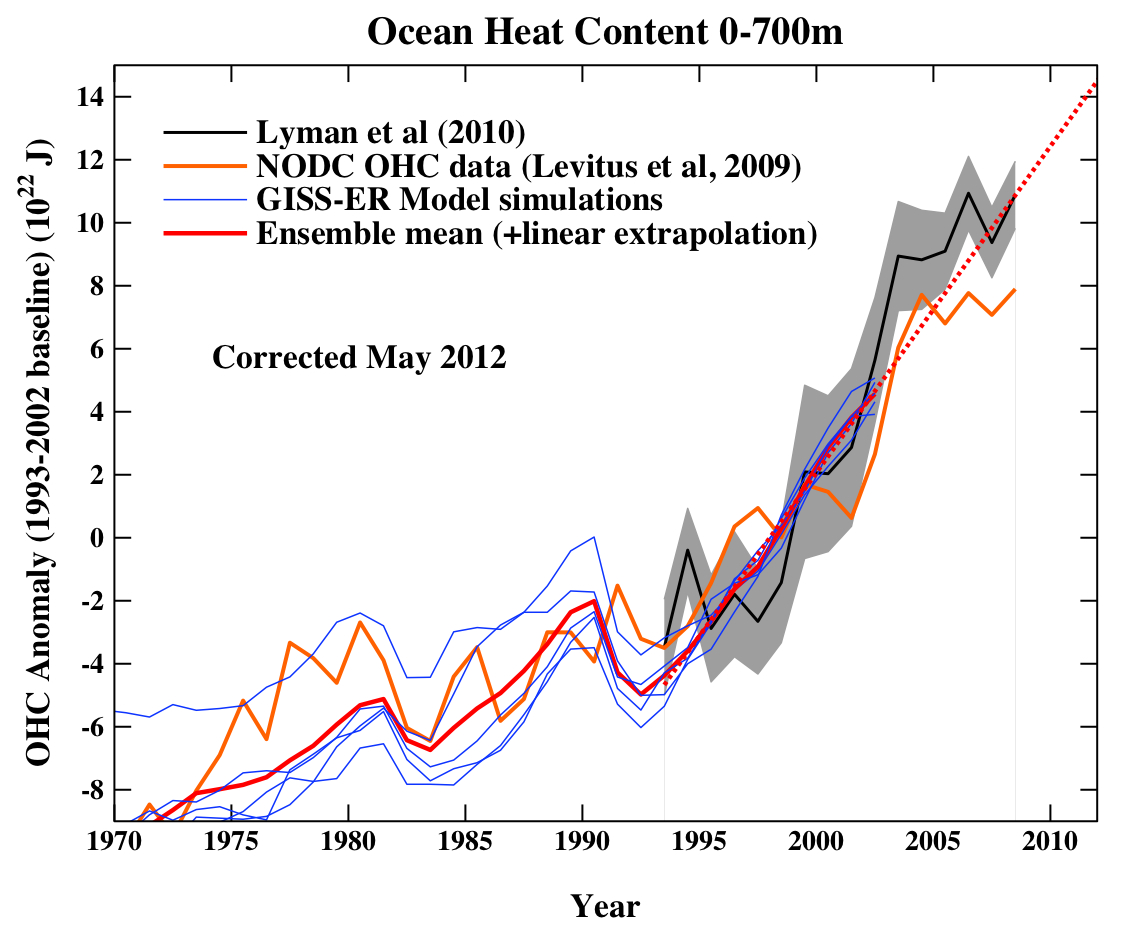
Figure 4. Lyman et al (2010) compared to the same models in Figure 2.

Data availability and quality control kept increasing and that allowed Levitus et al (2012) to update their dataset again:


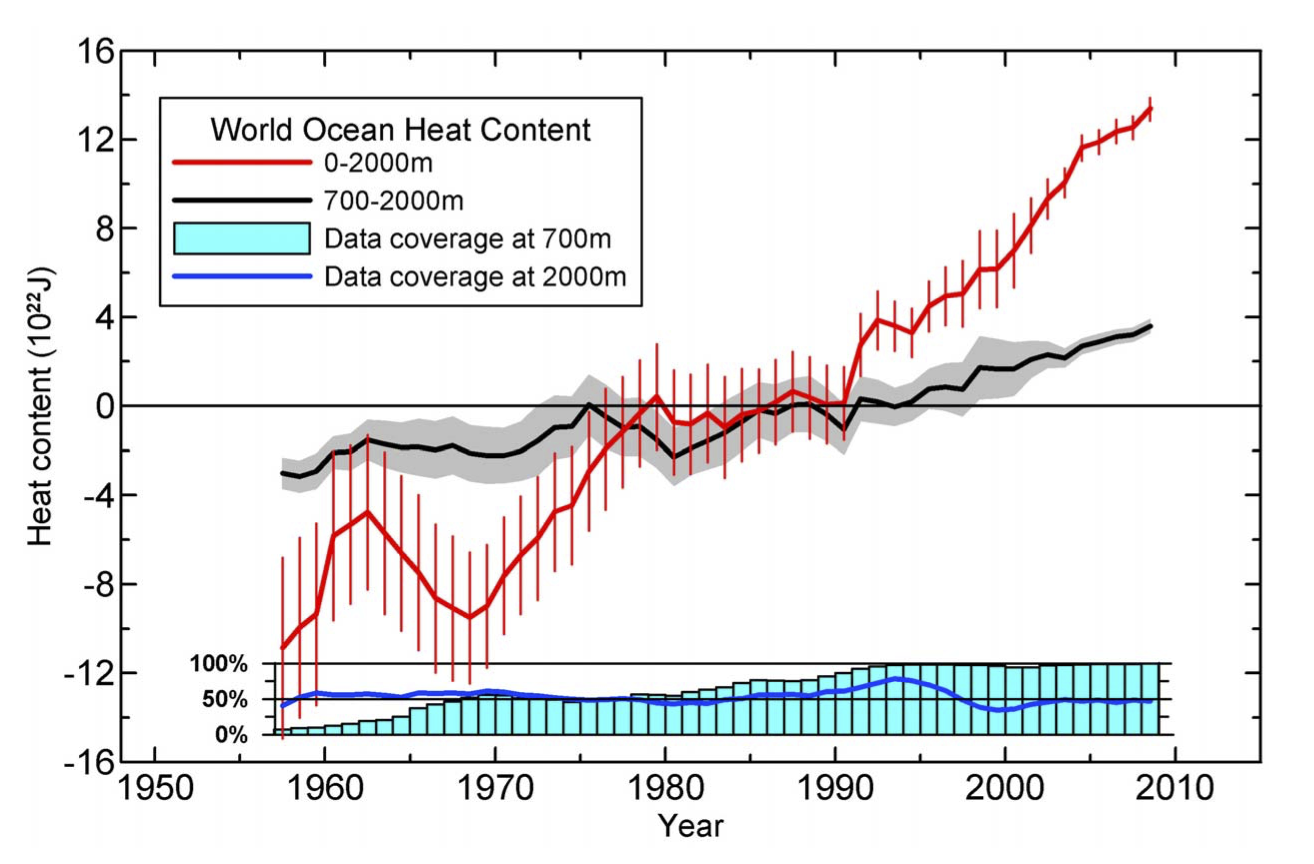
Figure 5. Levitus et al (2012).

It will come as no surprise that all of this back and forth as data sets were improved and issues found and resolved, that there has been plenty of fodder for contrarians. From being too credulous when analyses appeared to show cooling, and too eager to accept that model-observation discrepancies are always the fault of the models, they often didn’t appreciate that actual science can be messy and is full of stops and starts as new ground is broken.

Synthesis

In recent years, the updates to ocean heat content have become routine, operationally available on a quarterly or annual basis via NODC, PMEL, CSIRO, and others like Cheng et al. (2015) etc. In the IPCC AR5 (2013) (Ch 3, Box 3.1) the rate of ocean heat uptake was estimated to be 257 TW for 1993–2010 equivalent to a mean global heat flux of 0.5 W/m2.

Additionally, these data are updated and summarized for the annual BAMS State of the Climate (the latest edition coming out in 2018 covering the trends through 2017):


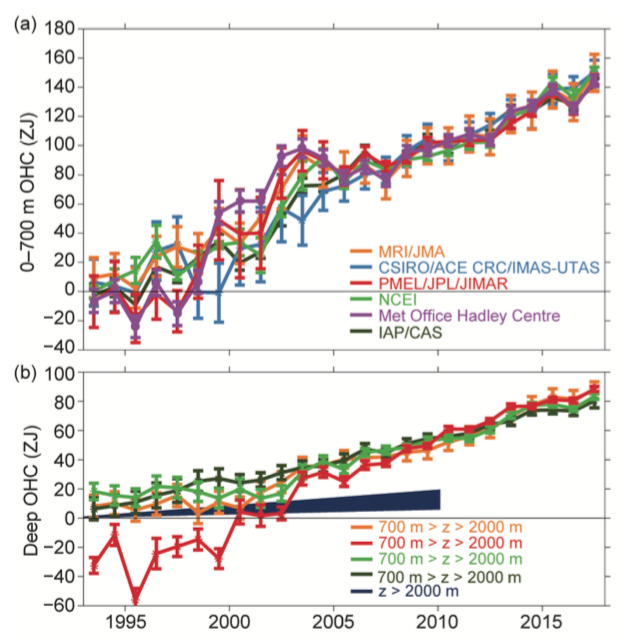
Figure 6. Johnson et al (2018) in BAMS SOTC.

For reference, the SOTC estimates (1993-2017) for the full depth of the ocean, which range from 0.62 to 0.79 W/m2, are already 25% to 60% bigger than was assessed in the IPCC AR5 report.

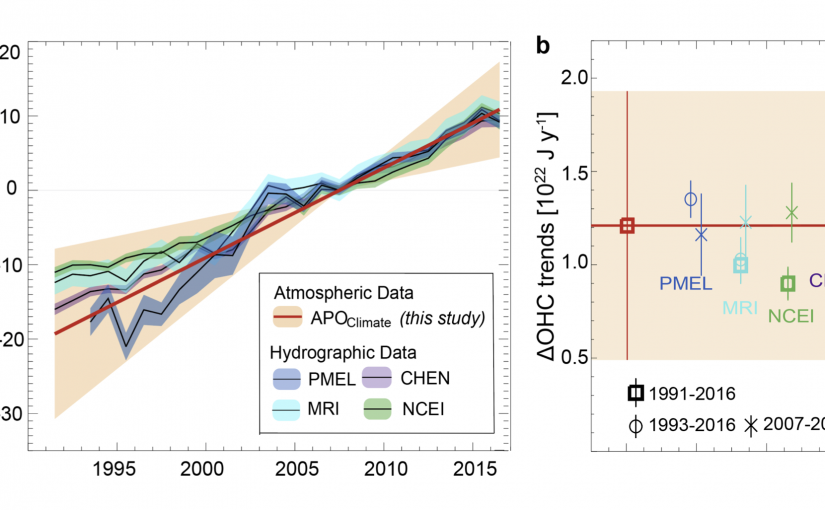
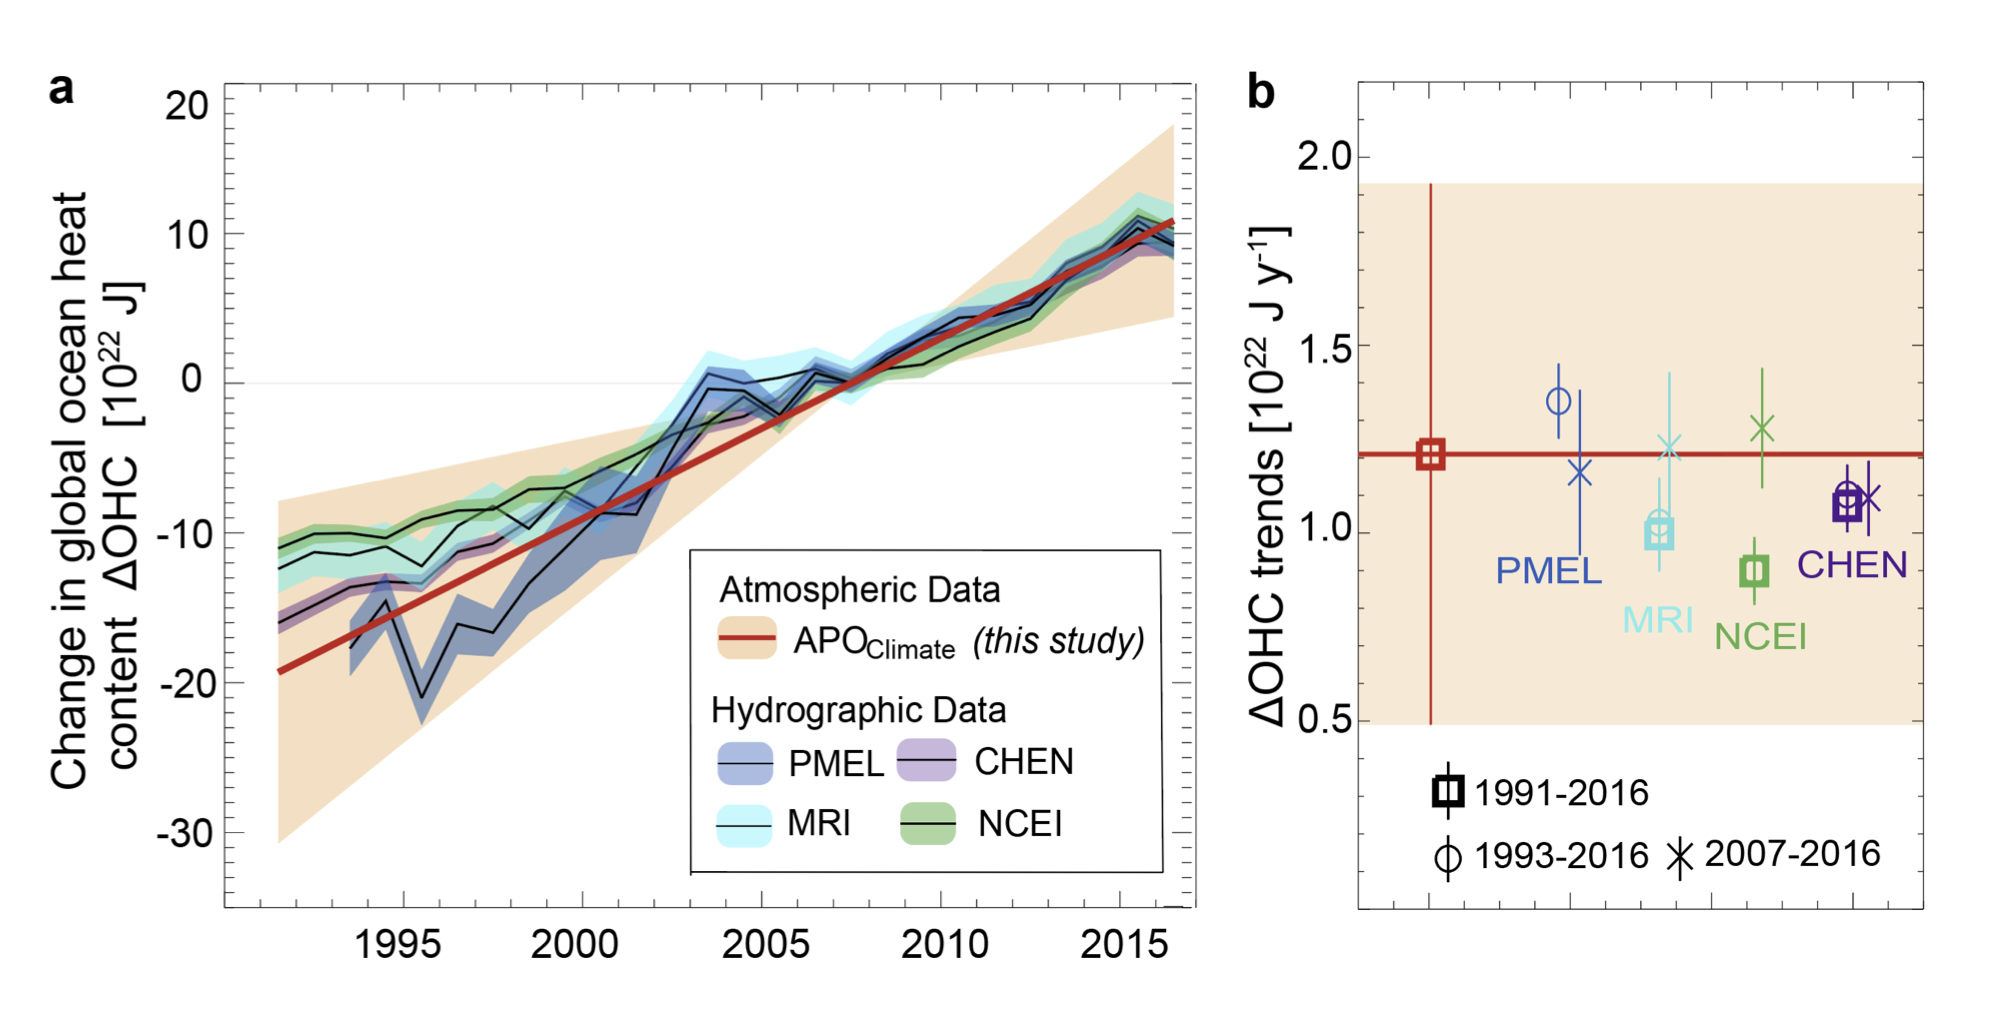
Independent confirmation?

Recently, a totally independent geochemical method based on the changing solubility of O2 and CO2 in the warming ocean (Resplandy et al, 2018) came up with a trend that was comparable to the rates in Fig. 6. Unfortunately, there were a couple of errors in the published analysis, but the corrected trends, 0.76 ± 0.45 W/m2, are nicely in line with the latest instrument-based numbers. The uncertainties in this methodology are too large for this paper to be definitive independent confirmation but, now that this method has been tried out, further work may well reduce them.

Synthesis

As a topic, this key measure of climate change has had more than it’s fair share of false starts, corrections, revisions and updates (including from me). The complexity of wrestling with data streams that were not designed to track this issue until recently, combined with the intense interest in the answer which has attracted substantial independent work and scrutiny, has now however produced an overall synthesis that is clear.

So what does this look like?


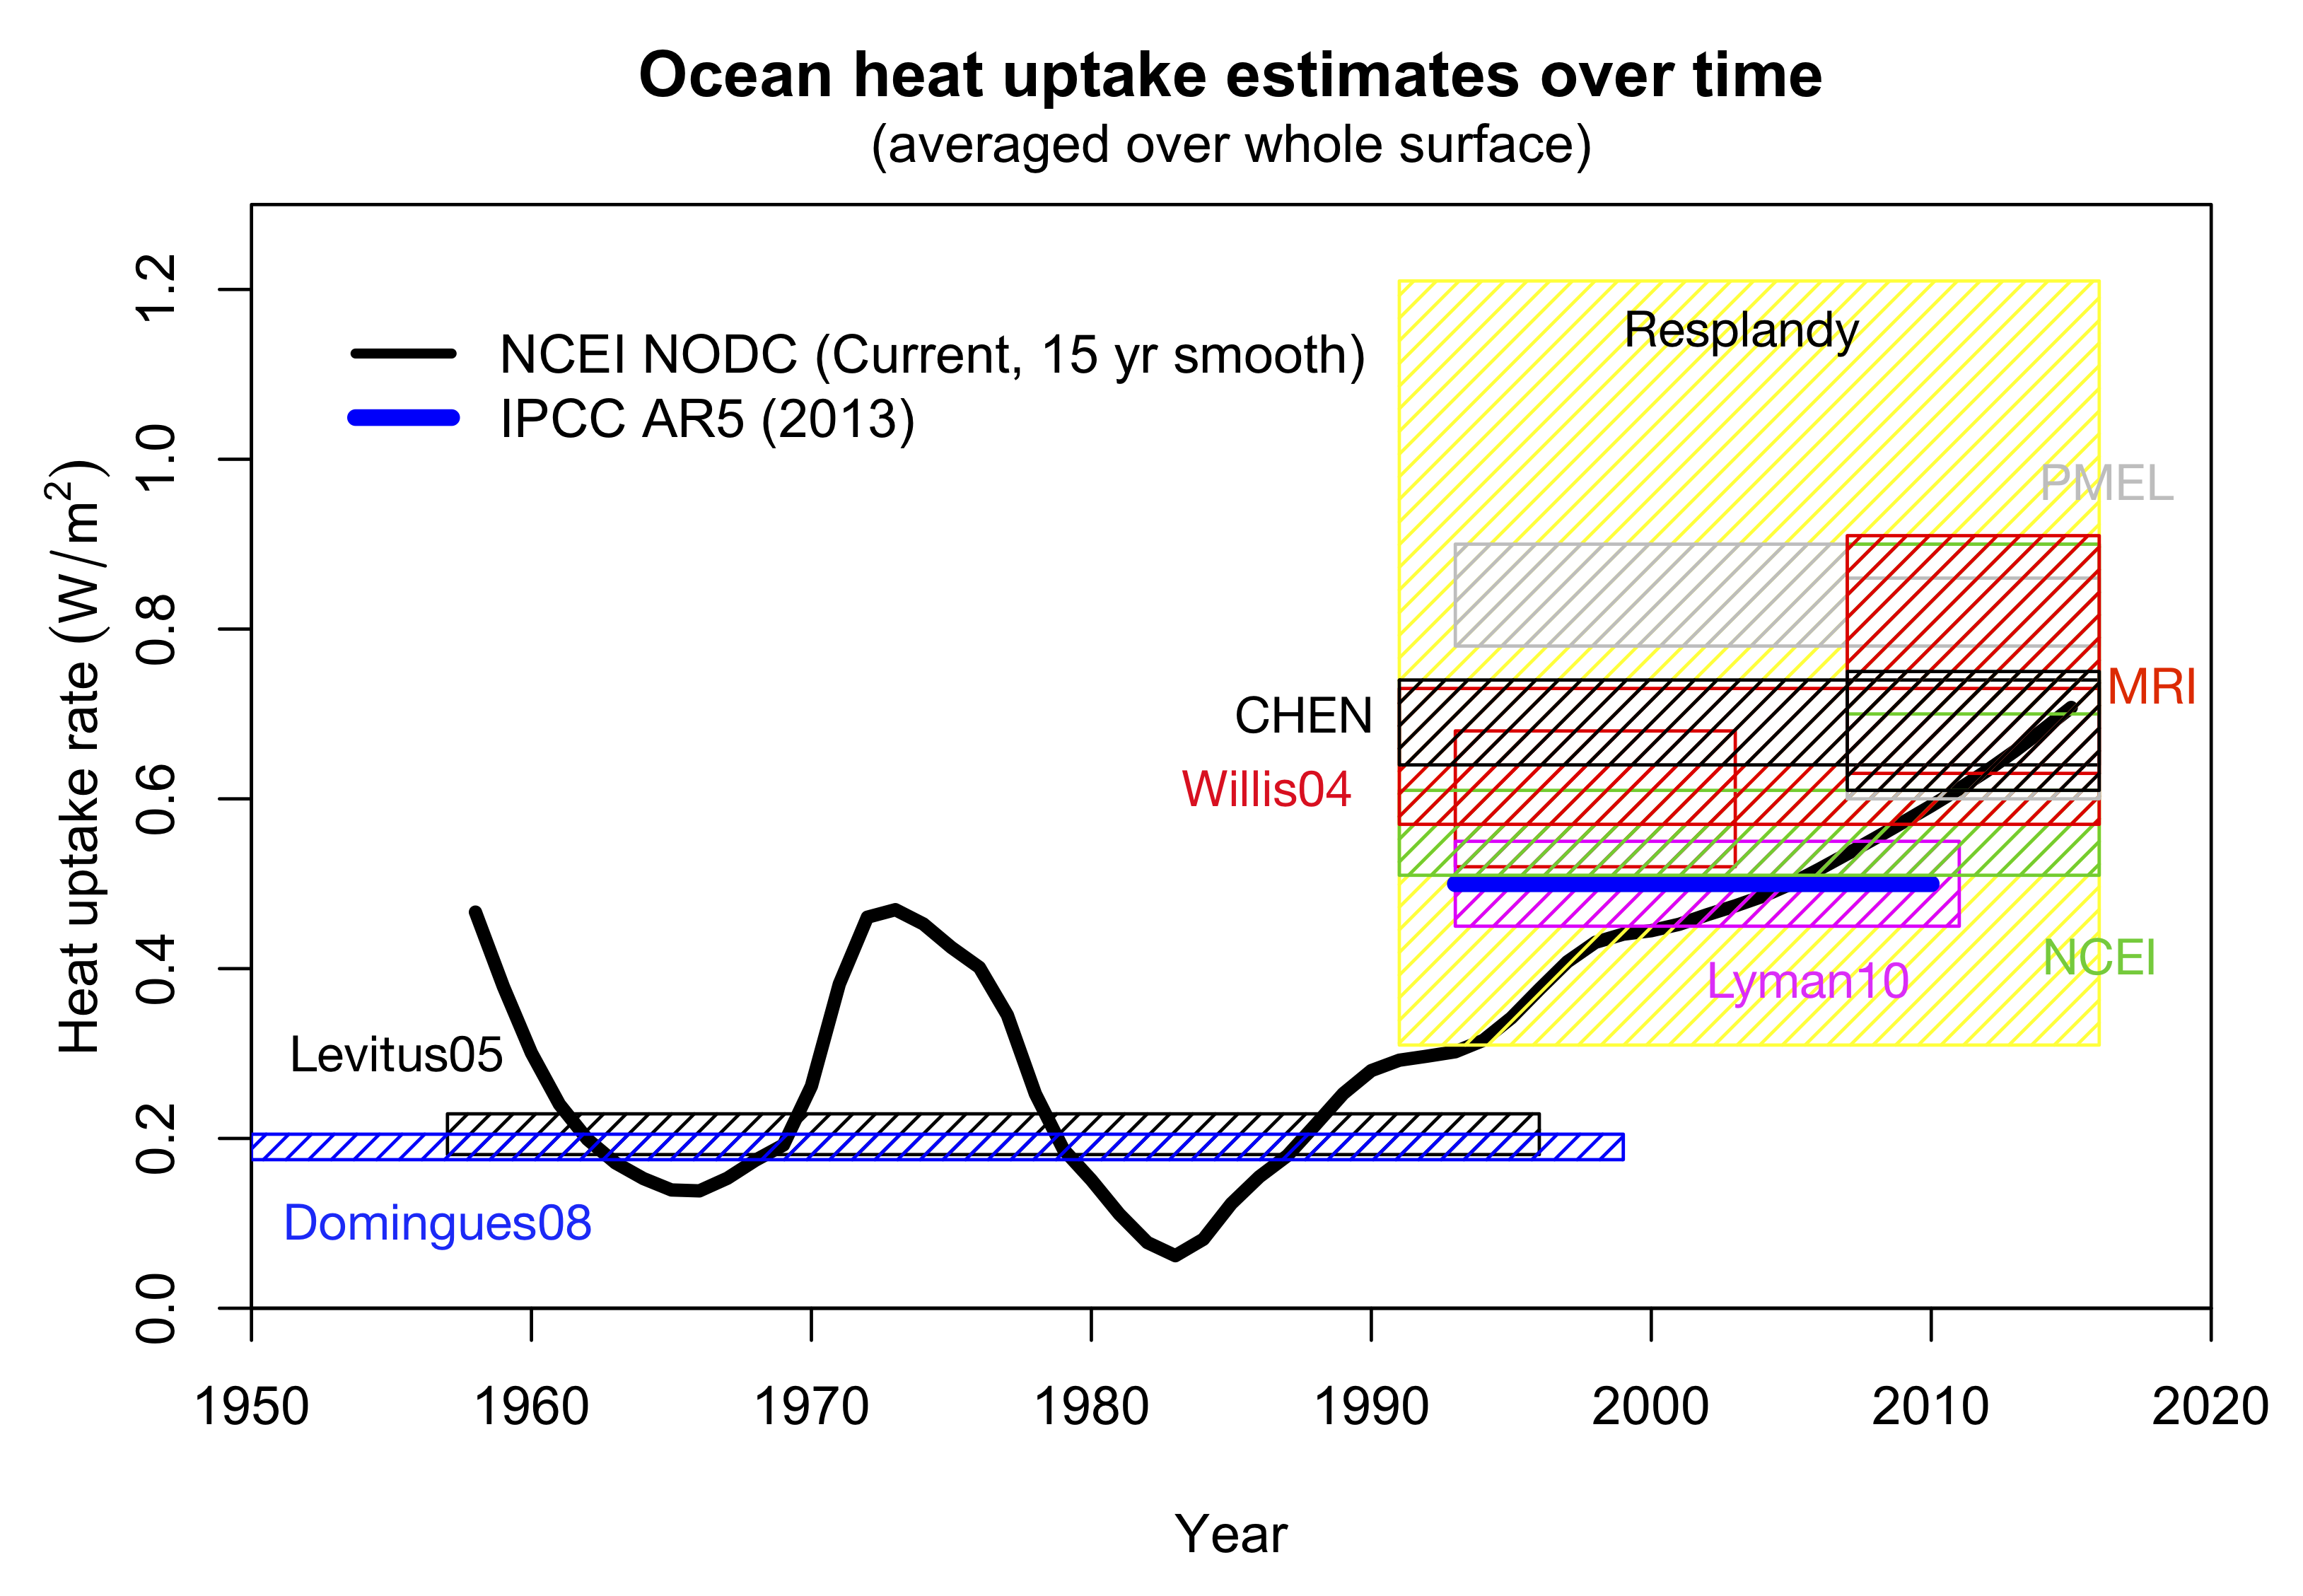
Figure 7. Ocean heat uptake estimates over the years (in W/m2 averaged over the whole surface). Values are for 0-2000m or 0-3000m where available, with the exception of the Willis et al (2004) and Lyman et al (2010) estimates which are 0-700m. Uncertainties are 1 standard error. PMEL/MRI/NCEI/CHEN trends are taken from Resplandy et al.

As was stated in the IPCC report:

It is virtually certain that the upper ocean (0–700 m) warmed from 1971–2010. […] Deeper in the ocean, it is likely that the waters from 700–2000 m have warmed on average between 1957 and 2009 […]

The evidence suggests that ocean heat uptake has accelerated over the last couple of decades, and is likely higher than was reported in IPCC in 2013. The Resplandy et al estimates are consistent with the newer data.

Going back to where we started, what does this allow to conclude about recent climate change? First, the size of the uptake implies that there indeed must be a significant energy imbalance for the planet. This in turn means there must be a larger radiative forcing driving this (for instance, due to the rise in greenhouse gases or an increase in solar activity – other evidence allows us to distinguish between these). But most importantly, this was a predicted effect, made in the earliest (and most basic) simulations as a consequence of a non-negligible climate sensitivity and greenhouse gas increases. In all the hubbub surrounding the latest paper, one would do well to remember that.

References


  1. J. Hansen, I. Fung, A. Lacis, D. Rind, S. Lebedeff, R. Ruedy, G. Russell, and P. Stone, “Global climate changes as forecast by Goddard Institute for Space Studies three-dimensional model”, Journal of Geophysical Research, vol. 93, pp. 9341, 1988. http://dx.doi.org/10.1029/JD093iD08p09341


  2. S. Levitus, “Warming of the World Ocean”, Science, vol. 287, pp. 2225-2229, 2000. http://dx.doi.org/10.1126/science.287.5461.2225


  3. S. Levitus, “Warming of the world ocean, 1955–2003”, Geophysical Research Letters, vol. 32, 2005. http://dx.doi.org/10.1029/2004GL021592


  4. K.M. AchutaRao, B.D. Santer, P.J. Gleckler, K.E. Taylor, D.W. Pierce, T.P. Barnett, and T.M.L. Wigley, “Variability of ocean heat uptake: Reconciling observations and models”, Journal of Geophysical Research, vol. 111, 2006. http://dx.doi.org/10.1029/2005JC003136


  5. J.K. Willis, “Interannual variability in upper ocean heat content, temperature, and thermosteric expansion on global scales”, Journal of Geophysical Research, vol. 109, 2004. http://dx.doi.org/10.1029/2003JC002260


  6. J. Hansen, “Earth’s Energy Imbalance: Confirmation and Implications”, Science, vol. 308, pp. 1431-1435, 2005. http://dx.doi.org/10.1126/science.1110252


  7. V. Gouretski, and K.P. Koltermann, “How much is the ocean really warming?”, Geophysical Research Letters, vol. 34, 2007. http://dx.doi.org/10.1029/2006GL027834


  8. S. Levitus, J.I. Antonov, T.P. Boyer, R.A. Locarnini, H.E. Garcia, and A.V. Mishonov, “Global ocean heat content 1955-2008 in light of recently revealed instrumentation problems”, Geophysical Research Letters, vol. 36, pp. n/a-n/a, 2009. http://dx.doi.org/10.1029/2008GL037155


  9. C.M. Domingues, J.A. Church, N.J. White, P.J. Gleckler, S.E. Wijffels, P.M. Barker, and J.R. Dunn, “Improved estimates of upper-ocean warming and multi-decadal sea-level rise”, Nature, vol. 453, pp. 1090-1093, 2008. http://dx.doi.org/10.1038/nature07080


  10. M. Ishii, and M. Kimoto, “Reevaluation of historical ocean heat content variations with time-varying XBT and MBT depth bias corrections”, Journal of Oceanography, vol. 65, pp. 287-299, 2009. http://dx.doi.org/10.1007/s10872-009-0027-7


  11. S. Levitus, J.I. Antonov, T.P. Boyer, O.K. Baranova, H.E. Garcia, R.A. Locarnini, A.V. Mishonov, J.R. Reagan, D. Seidov, E.S. Yarosh, and M.M. Zweng, “World ocean heat content and thermosteric sea level change (0-2000 m), 1955-2010”, Geophysical Research Letters, vol. 39, pp. n/a-n/a, 2012. http://dx.doi.org/10.1029/2012GL051106


  12. L. Cheng, K.E. Trenberth, J. Fasullo, T. Boyer, J. Abraham, and J. Zhu, “Improved estimates of ocean heat content from 1960 to 2015”, Science Advances, vol. 3, pp. e1601545, 2017. http://dx.doi.org/10.1126/sciadv.1601545


  13. G. Hartfield, J. Blunden, and D.S. Arndt, “State of the Climate in 2017”, Bulletin of the American Meteorological Society, vol. 99, pp. Si-S310, 2018. http://dx.doi.org/10.1175/2018BAMSStateoftheClimate.1


  14. L. Resplandy, R.F. Keeling, Y. Eddebbar, M.K. Brooks, R. Wang, L. Bopp, M.C. Long, J.P. Dunne, W. Koeve, and A. Oschlies, “Quantification of ocean heat uptake from changes in atmospheric O2 and CO2 composition”, Nature, vol. 563, pp. 105-108, 2018. http://dx.doi.org/10.1038/s41586-018-0651-8

American Forests Responds: California Wildfires

November 19th, 2018|Tags: , , , |

About the California Wildfires

Two massive wildfires burn at opposite ends of California. Both fires started on November 8, 2018. The Camp Fire has burned 149,000 acres and the Woolsey Fire has burned 98,362 acres thus far. Below are facts sourced from experts to help you understand the severity of the fires and what we can do together to move forward.

Wildfire Facts:

  • Some CA forests have 1,000 trees per acre, where 40-60 per acre would be ideal.
  • Nationally, there are 1000% more forest fires burning in any given year since the 1970s.
  • More than half of the U.S. Forest Service budget is used to battle wildfires.
  • Nationally, 11 out of the last 19 years, more than 10,000 sq miles have burned.
  • Nationally, the average wildfire season is 78 days longer than it was in 1970.
  • 358 weeks of drought since 2011 in CA.

California has worked tirelessly to reduce wildfire risk in their state, but they cannot do it alone.

Keep your eyes on our Action Center for ways you can urge Congress to support the Collaborative Forest Landscape Restoration Program in FY19 and FY20 to reduce the risk of wildfire and support resilient forests.

California Wildfires statistics and effects on forests

Share this infographic! Right click and hit ‘save as,’ then share on your social media channels to help us spread the facts about the recent fires in California.

The post American Forests Responds: California Wildfires appeared first on American Forests.

Black Chokecherry (Prunus virginiana var. melanocarpa)

American Forests National Tree Register, Species: Black Chokecherry (Prunus virginiana var. melanocarpa), State: MT
Description

Location Flathead, MT

Black Chokecherry

Prunus virginiana var. melanocarpa

This champion Black Chokecherry of Montana made its debut on the list of American Forests Champion Trees in , as it is the largest known tree of its species in the country. By recognizing these champions, we recognize the beauty and critical ecosystem services provided by our biggest and oldest trees.

jQuery(window).load(function(){
jQuery(‘.bt_images_slider’).bxSlider({
mode: ‘fade’,
captions: false,
adaptiveHeight: true,
slideWidth: ‘auto’,
preloadImages: ‘all’,
pager: false,
controls: false,
nextSelector: ‘#bt_images_slider’,
auto: false,
speed: 0,
onSliderLoad: function(){
jQuery(‘#bt_images_slider’).css(‘visibility’, ‘visible’);
}
});
});

STATUS Champion
Tree circumference 39
height 66
crown spread 22
Total points 111

LOCATION Flathead, MT
Nominated by Mark Lewing, Trever, Joshua & Trystan Mertins
Year Nominated 2016
Date crowned

Other Champion Trees

Prunus virginiana var. demissa

Crataegus castlegarensis

Alnus viridis ssp. sinuata

Help us honor and protect our nation’s Champion Trees.

Ways to Engage

search-icon

Search

Search the American Forests Champion Tree national register.

Nominate

Nominate a big tree that you think can achieve champion status.

Explore

Browse stories on our blog, Loose Leaf, and get to know the people and champions that make up the program.

Subscribe

Sign up for our big tree email list and receive year-round updates on the program.

The post Black Chokecherry (Prunus virginiana var. melanocarpa) appeared first on American Forests.

Forest Digest: November 18, 2018

November 18th, 2018|Tags: , , , |

Check out what’s going on in forest and environmental news this week!

New Study Reveals Natural Solutions Can Reduce Global Warming — The Nature Conservancy

A study published this week finds that better management of U.S. forests, grasslands and soils has the potential to offset the country’s greenhouse gas emissions by more than 20 percent. That would be roughly equivalent to omitting emissions from all vehicles in the U.S.

In California, Climate Change Has Turned Rainy Season Into Fire Season — New York Magazine

November has typically signaled the end of fire season in California as the rains make their way into the usually dry state. Now state firefighters refer to wildfire season as “year-round,” and if no changes occur, the amount of land burned in California is expected to increase sixteen-fold by 2100.

More than one-third of critically endangered plants cannot be conserved in seed banks — Mongabay

Studies show that 36 percent of threatened plants and trees produce seeds that cannot undergo the process necessary to conserve them in a seed bank, which includes drying out the seeds and storing them at -4° Fahrenheit (-20° Celsius). Researchers say urgent investments in alternative techniques are needed for such recalcitrant species to be conserved, which is part of a larger goal to conserve 75 percent of threatened plants in non-natural habitats by 2020.

Climate change: Worries over CO2 emissions from intensifying wildfires — BBC

Scientists are concerned about the amount of CO2 released into the atmosphere by increasingly intense wildfires. Estimates vary, but some experts think wildfires account for up to 20% of yearly carbon emissions. Left unchecked, that number could rise to around 30% by the end of the century.

Your Children’s Yellowstone Will Be Radically Different — The New York Times

Yellowstone National Park, known as a wild animal haven, is suffering the effects of climate change, which are happening faster than many species can adapt to them. Researchers who have been in the area for decades agree: Yellowstone will be a different place for the next generation- but what will that look like?

The bird that has baffled scientists: Weird warbler is THREE species in one —Daily Mail

A strange bird in Pennsylvania is the offspring of a hybrid warbler mother and a warbler father from a different genus, making the bird a hybrid of three different species. The strange bird was first discovered by a birdwatcher, then tests confirmed the bird’s unusual genetics. Researchers are keeping an eye out to see if the strange bird will be able to successfully mate or if he will be ignored by other warblers.

The post Forest Digest: November 18, 2018 appeared first on American Forests.

Resplandy et al. correction and response

Guest commentary from Ralph Keeling (UCSD)

I, with the other co-authors of Resplandy et al (2018), want to address two problems that came to our attention since publication of our paper in Nature last week. These problems do not invalidate the methodology or the new insights into ocean biogeochemistry on which it is based, but they do influence the mean rate of warming we infer, and more importantly, the uncertainties of that calculation.

We would like to thank Nicholas Lewis for first bringing an apparent anomaly in the trend calculation to our attention. We quickly realized that our calculations incorrectly treated systematic errors in the O2 measurements as if they were random errors in the error propagation. This led to under-reporting of the overall uncertainty and also caused the ocean heat uptake to be shifted high through the application of a weighted least squares fit. In addition, we realized that the uncertainties in the assumption of a constant land O2:C exchange ratio of 1.1 in the calculation of the “atmospheric potential oxygen” (APO) trend had not been propagated through to the final trend.

As the researcher in charge of the O2 measurements, I accept responsibility for these oversights, because it was my role to ensure that details of the measurements were correctly understood and taken up by coauthors.

We have now reworked our calculations and have submitted a correction to the journal.

Details

In our definition ΔAPO, we used a default value of 1.1 for O2:C oxidative ratio (OR) of land carbon. However, a lower ratio is probably more appropriate. Specifically, Randerson et al. (2006) argued for a ratio of around 1.05, based on the composition of stems and wood, given that woody biomass dominates long­term carbon sources and sinks on land. Other recent studies have suggested similar ratios e.g. Clay and Worrall (2015). Our previous calculations did, in fact, allow for a range from 1.05 ± 0.05, consistent with above estimates and typical uncertainty ranges. However, we applied this range only for the ΔAPOClimate­ to­ ΔOHC ratio but neglected the impact on the APO budget itself, which used a fixed ratio of 1.1. If the actual OR were lower than 1.1, the observed APO decrease (ΔAPOOBS) would include a contribution from the global land carbon sink, because the ΔO2 term then imperfectly cancels the 1.1 ΔCO2 term.

In the updated calculations we now also allow apply the OR range (1.05 ± 0.05) to the APO calculation which by itself increases the APOClimate trend by 0.15 ± 0.15 per meg/y­r relative to an estimate using 1.1.

Bottom Line

We recomputed the ΔAPOClimate trend and its uncertainty based on the distribution of the unweighted least square fits to each of the 106 ensemble realizations of ΔAPOClimate generated by combining all sources of uncertainty, with correlated errors now treated as systematic contributions to the trend. The resulting trend in ΔAPOClimate is 1.05 ± 0.62 per meg/y­r (previously 1.16 ± 0.18 per meg/yr) which yields a ΔOHC trend of 1.21 ± 0.72 x 10²² J/yr (previously 1.33 ± 0.20 x 10²² J/yr), as summarized in the updated Figure 1:

The revised uncertainties preclude drawing any strong conclusions with respect to climate sensitivity or carbon budgets based on the APO method alone, but they still lend support for the implications of the recent upwards revisions in OHC relative to IPCC AR5 based on hydrographic and Argo measurements.

References


  1. L. Resplandy, R.F. Keeling, Y. Eddebbar, M.K. Brooks, R. Wang, L. Bopp, M.C. Long, J.P. Dunne, W. Koeve, and A. Oschlies, “Quantification of ocean heat uptake from changes in atmospheric O2 and CO2 composition”, Nature, vol. 563, pp. 105-108, 2018. http://dx.doi.org/10.1038/s41586-018-0651-8


  2. J.T. RANDERSON, C.A. MASIELLO, C.J. STILL, T. RAHN, H. POORTER, and C.B. FIELD, “Is carbon within the global terrestrial biosphere becoming more oxidized? Implications for trends in atmospheric O2”, Global Change Biology, vol. 12, pp. 260-271, 2006. http://dx.doi.org/10.1111/j.1365-2486.2006.01099.x


  3. G.D. Clay, and F. Worrall, “Oxidative ratio (OR) of Southern African soils and vegetation: Updating the global OR estimate”, CATENA, vol. 126, pp. 126-133, 2015. http://dx.doi.org/10.1016/j.catena.2014.10.029

Surprises from Wisconsin

November 14th, 2018|Tags: , |

By Claudia España and Liz Harper, American Forests

In June, American Forests received an unexpected surprise at our office: a hefty envelope from Madison, Wisconsin. Inside, we found a bundle of letters and a check made out to American Forests for a donation of $39 from a class of fourth grade students at Henry David Thoreau Elementary School.

The students had been researching nonprofits as part of a class project. Each student picked a nonprofit to research and wrote a Public Service Announcement on the organization of their choice. The students presented their findings and voted on their preferred charity. In the end, the students chose American Forests as their favorite!

The winning PSA came from Noah M., who prepared a persuasive argument and delivered it to his classmates. After they’d chosen the winner, each student wrote a letter to us about why they chose American Forests as the recipient of their donation, which was the result of the students collecting spare change.

The 23 letters addressed a wide range of reasons why they felt American Forests was worthy of their support. The students recognized that trees are helpful to the environment, especially in cities like theirs. Several students with asthma pointed out that having more trees would be beneficial for their health, too. “The more trees you plant, the easier it is for me and other people (even if they don’t have asthma) to breathe. It seems to me that places that don’t have a lot of trees are harder to breathe in…” read a letter by a student named Aaron. Clearly, they understand the correlation between healthy trees in the environment and human health.

Throughout the course of this project, which they’d worked hard to complete before the end of the school year, the students came to understand that even spare change can help American Forests plant trees. Every dollar enables us to plant one tree, and every tree makes a difference. The fourth graders made it clear that they wanted to ensure healthy, thriving forests will be around for to them to enjoy as they grow into adulthood, and saw their donation as a way to make that happen.

At American Forests, we were very touched by the unexpected donation and impressed by the students’ hard work, research and discerning choice. The students and their letters have been an encouraging reminder of why we work to create healthy forests across the country – not only for children like these, but also for future generations.

To reward them for their thoughtful generosity, we sent them a handmade card, signed by our staff members, and bookmarks to share with the whole school. As a special thank you for our champion, Noah, we included an American Forests ball cap for him to wear proudly.

Thank you Thoreau Elementary for helping us make a real difference for our forests and our planet!

The post Surprises from Wisconsin appeared first on American Forests.