Established understanding of the AMOC (sometimes popularly called Gulf Stream System) says that a weaker AMOC leads to a slightly cooler global mean surface temperature due to changes in ocean heat storage. But now, a new paper in Nature claims the opposite and even predicts a phase of rapid global warming. What’s the story?
By Stefan Rahmstorf and Michael Mann
In 1751, the captain of an English slave-trading ship made a historic discovery. While sailing at latitude 25°N in the subtropical North Atlantic Ocean, Captain Henry Ellis lowered a “bucket sea-gauge” down through the warm surface waters into the deep. By means of a long rope and a system of valves, water from various depths could be brought up to the deck, where its temperature was read from a built-in thermometer. To his surprise Captain Ellis found that the deep water was icy cold.
These were the first ever recorded temperature measurements of the deep ocean. And they revealed what is now known to be a fundamental feature of all the world oceans: deep water is always cold. The warm waters of the tropics and subtropics are confined to a thin layer at the surface; the heat of the sun does not slowly warm up the depths as might be expected. Ellis wrote:
“This experiment, which seem’d at first but mere food for curiosity, became in the interim very useful to us. By its means we supplied our cold bath, and cooled our wines or water at pleasure; which is vastly agreeable to us in this burning climate.”
In 1797 another Englishman, Count Rumford, published a correct explanation for Ellis’ “useful” discovery:
“It appears to be extremely difficult, if not quite impossible, to account for this degree of cold at the bottom of the sea in the torrid zone, on any other supposition than that of cold currents from the poles.”
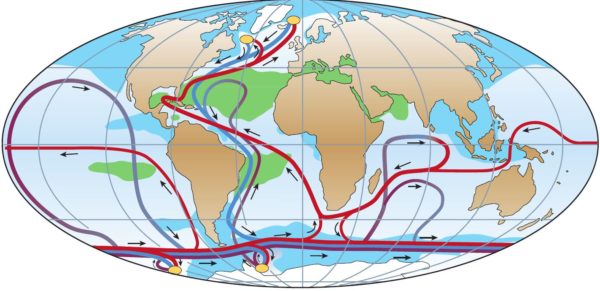
Thus the thermohaline overturning circulation was discovered. The deep sea is kept cold by what we now call “deep water formation”: the sinking of cold, dense water in the subpolar Atlantic and Antarctic oceans down into the deep, where it spreads around the globe. In equilibrium, the temperatures of the deep ocean are kept constant by the balance of two opposing trends: a warming tendency by turbulent diffusion of heat from above, and a cooling tendency by the inflow of cold water from the poles, i.e. deep water formation.
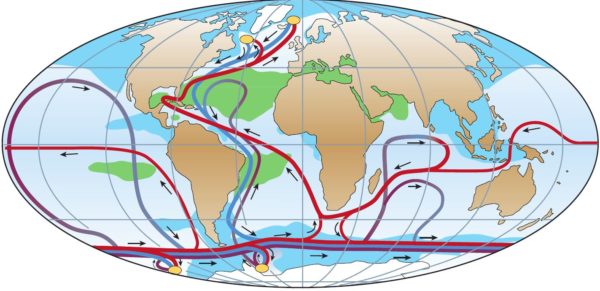
The global thermohaline overturning circulation (from Rahmstorf, Nature 2002)
If the rate of thermohaline overturning slows down, then heat diffusion gains the upper hand and the deep ocean warms. If it speeds up, the opposite happens and the deep ocean cools. Model simulations show that this is true for decadal variability (e.g. Knight et al. 2005) as well during global warming (e.g. Liu et al. 2017). Knight et al. found that decadal variability of the AMOC can cause small variations in global mean surface temperature, with a strong AMOC linked to high global surface temperatures. Liu et al. found that their climate model warms less under the same greenhouse gas scenario when the AMOC is weakened more.
It is surprising, then, that today a paper was published in Nature that claims the exact opposite: namely that a strong overturning circulation warms rather than cools the deep ocean. The idea is that the increasing heat accumulating at the surface through the increasing greenhouse effect is brought down into the ocean depths by deep water formation, thus reducing warming at the surface. But is this true, and what is the evidence for it?
The evidence
The great Carl Sagan once said that extraordinary claims require extraordinary evidence, so we approached the paper by Chen and Tung with considerable curiosity. We were soon disappointed, however. The only evidence presented is the putative coincidence of two phases of slow global surface warming (1942-1975 and 1998-2014) with strong AMOC (i.e. Atlantic Meridional Overturning Circulation), and a phase of more rapid warming (1975-1998) with weak AMOC (their Fig. 3). There is no statistical examination of this supposed correlation. A number of further graphs showing various spatial patterns do nothing to support the new hypothesis: these graphs just show well-known patterns like the interhemispheric see-saw effect of AMOC variations and the Zhang fingerprint (also shown by Caesar et al. in Nature earlier this year), which are fully consistent with the established view of the effect of AMOC variability on ocean temperatures. Indeed one of us (Mike) has co-authored the paper by Knight et al. showing that natural variability in the AMOC sometimes called the “Atlantic Multidecadal Oscillation” or “AMO” (a term originally coined by Mike) demonstrates an in-phase relationship between large-scale surface warming and the strength of the AMO, i.e. the opposite of what the present authors claim. The peak impact on global mean temperature, incidentally, is found to be only ~0.1C, calling into question any claim that trends in global mean temperature will be substantially influenced by the phase of the AMO.
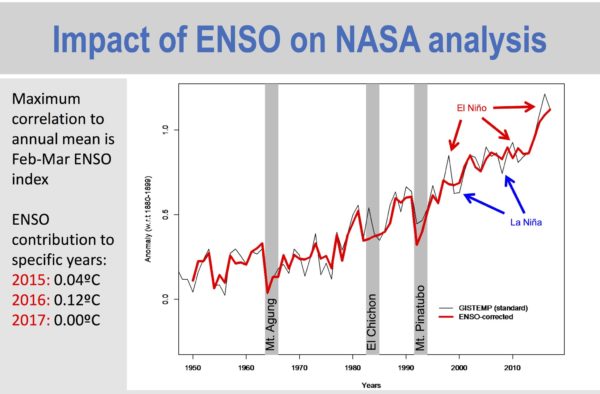
And as our regular Realclimate readers know very well, the distinction of phases of fast global warming up to 1998 and slow warming from 1998 is highly questionable. First of all, 1998 is the year with the strongest upward spike in global temperature and the strongest El Niño event on record. Second, the supposed “warming slowdown” after 1998 is known to be largely an artifact of the HadCRUT temperature data, because these do not cover the Arctic which has warmed the most in this period. Other data – HadCRUT with infilled Arctic temperatures (Cowtan and Way), GISTEMP, NOAA, Berkeley – do not show this. (Guess which global temperature data set Chen and Tung exclusively used.) And the little variation in the global warming rate since 1975 which remains in these other data sets is strongly correlated with El Niño. Model simulations with the correct El Niño phase reproduce the observed global temperature evolution (Kosaka and Xie 2013), and if the El Niño effect is removed from the global temperature time series the rate of warming is steady (see next graph). There is thus much stronger evidence for an El Niño effect than for the AMOC hypothesis. The well-established explanations for the variations in global warming trend are unfortunately not discussed in the paper.
The mechanism
On the mechanism for why a strong AMOC would heat rather than cool the deep ocean, Chen and Tung write: “Deep convections can now carry more heat downward.” (Deep convection is the vertical mixing process at the beginning of deep water formation.) That should make anyone familiar with the conditions in the subpolar Atlantic stop. Isn’t deep convection thermally driven there, by surface water becoming colder and thereby denser than the deep water? After all, this is a region of net surface freshwater input, from precipitation, river runoff and ice melt, so in the convection areas the surface water is fresher than the deep water, which inhibits convection. Thermally driven convection moves heat upwards, not downwards.
To be sure, Realclimate asked veteran sea-going oceanographer Igor Yashayaev of the Bedford Institute of Oceanography in Canada, who has decades of experience studying convection in the subpolar Atlantic, whether there is any evidence for salinity-driven convection there which could carry heat downward? Yashayaev’s reply:
“In the polar and subpolar regions, under no circumstances we saw convection bringing warmer water down deep.”
Chen and Tung do not show any models simulations either to provide evidence that their mechanism can actually work, neither do they discuss the various published model results that have come to the opposite conclusion. Fig. 2 of their paper shows coherent subpolar temperature anomalies over the top 900 meters of water column – but that corresponds to the depth of the Gulf Stream, rather than that of deep convection, so in our view is more likely simply a result of the established fact that a stronger AMOC transports more warm water into the subpolar North Atlantic. That graph also shows that the surface Atlantic is in that case anomalously warm, going right against their hypothesis that the surface is made cooler by a stronger AMOC.
Anthropogenic AMOC slowdown
The abstract of the paper states that
“Our results, based on several independent indices, show that AMOC changes since the 1940s are best explained by multidecadal variability, rather than an anthropogenically forced trend.”
The phrasing of this as an either-or question is odd, given that most modern climate time series show a mixture of both: a long-term climate trend plus variability on different time scales. This is also what models predict for the AMOC, and there is considerable evidence in observational data that this is indeed the case (see Rahmstorf et al. 2015, Caesar et al. 2018 and this Realclimate article). So we were curious what analysis this statement in the abstract is based on. Unfortunately, no analysis about the presence or absence of a climatic or anthropogenic trend in the AMOC is found in the entire paper.
The paper does show the AMOC index attributed to Caesar et al. 2018 in its Fig. 3a, and Caesar et al. reported an anthropogenic AMOC slowdown. However, for reasons that we were unable to clarify in correspondence with the authors, the AMOC index they show is quite different from the one reported by Caesar et al., as a comparison with Fig. 6 of the latter paper immediately shows. In the version by Chen and Tung, the index is lacking the downward trend which was the main result of Caesar et al.
The forecast
The one feature of the paper that is likely to raise most media interest is a forecast for the coming decades. The authors predict “a prolonged AMOC minimum, probably lasting about two decades” which “will manifest as a period of rapid global surface warming”.
The prediction of an AMOC minimum lasting two decades is merely based on their assessment that a previous AMOC minimum lasted two decades, thus the next one should do the same. Neither Caesar’s AMOC index starting in 1870 nor the long proxy-based AMOC time series we presented in Rahmstorf et al. (2015) nor model simulations support the idea of such regularly repeating AMOC cycles. In addition there is forcing, e.g. from the increasing meltwater from Greenland, which will affect the future AMOC. And as discussed above, the idea that a weak AMOC promotes rapid global warming is in itself not supported by any convincing evidence.
It is difficult not to think of the prediction by Keenlyside et al. in Nature in 2008. These authors made headlines around the world by predicting a phase of global cooling, ironically also largely based on a prediction of weak AMOC but, based on model simulations, finding the opposite effect on global temperature as Chen and Tung claim. Back then the Realclimate team had solid reasons to predict that the forecast would turn out to be wrong – which indeed it did. This time, we once again do not doubt that rapid global warming will continue until we strongly reduce greenhouse gas emissions – but for reasons that have nothing to with the AMOC.

 Check out what’s happened this past week in forestry news!