A few weeks ago, we’ve argued in a paper in Nature that the Atlantic overturning circulation (sometimes popularly dubbed the Gulf Stream System) has weakened significantly since the late 19th Century, with most of the decline happening since the mid-20th Century. We have since received much praise for our study from colleagues around the world (thanks for that). But there were also some questions and criticisms in the media, so I’d like to present a forum here for discussing these questions and hope that others (particularly those with a different view) will weigh in in the comments section below.
Exhibit #1, and the prime observational finding, is a long-term cooling trend in the subpolar Atlantic – the only region in the world which has cooled while the rest of the planet has warmed. This ‘cold blob’ or ‘warming hole’ has been shown in IPCC reports since the 3rd assessment of 2001; it is shown in Fig. 1 in a version from the last (5th) IPCC report. In fact it is Figure 1 of the Summary for Policy Makers there – you can’t get more prominent than that.
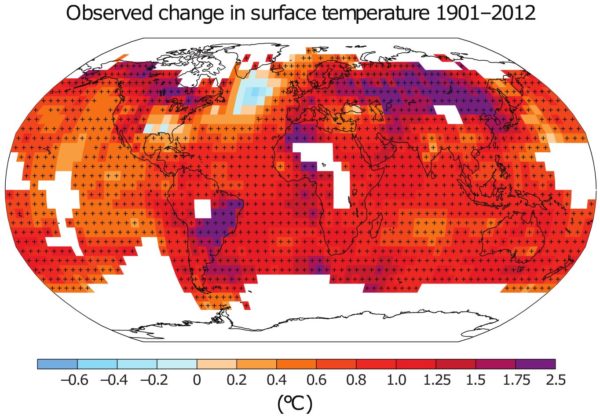
Fig. 1 Observed temperature trends since the beginning of the 20th Century (Figure SPM1 of the last IPCC report).
I think there is a consensus that this is a real phenomenon and can’t be explained away as a data problem. According to NOAA, 2015 was the coldest year in this region since record-keeping began in 1880, while it was the hottest year globally. The key question thus is: what explains this cold blob?
In 2010, my colleagues Dima and Lohmann from Bremen were the first (as far as I know – let me know if you find an earlier source) to suggest, using sea surface temperature (SST) pattern analyses, that the cold blob is a tell-tale sign of a weakening AMOC. They wrote that
“the decreasing trend over the last seven decades is associated to the weakening of the conveyor, possibly in response to increased CO2 concentrations in the atmosphere”
(with ‘conveyor’ they refer to the AMOC). One of several arguments for this was the strong anti-correlation pattern between north and south Atlantic which they found using canonical correlation analysis and which is the well-known see-saw effect of AMOC changes.
I have since become convinced that Dima and Lohman were right. Let me list my main arguments upfront before discussing them further.
- The cold blob is a prediction come true. Climate models have long predicted that such a warming hole would appear in the subpolar Atlantic in response to global warming, due to an AMOC slowdown. This is seen e.g. in the IPCC model projections.
- There is no other convincing explanation for the cold blob. There is strong evidence that it is neither driven by internal atmospheric variability (such as the North Atlantic Oscillation, NAO) nor by aerosol forcing.
- A range of different data sets and analyses suggest a long-term AMOC slowdown.
- Claims that the slowdown is contradicted by current measurements generally turn out to be false. Such claims have presented apples-to-oranges comparisons. To the contrary, what we know from other sources about the AMOC evolution is largely consistent with the AMOC reconstruction we presented in Nature.
Let us look at these four points in turn.
A climate prediction come true
The following graph shows climate projections graph from the last IPCC report.
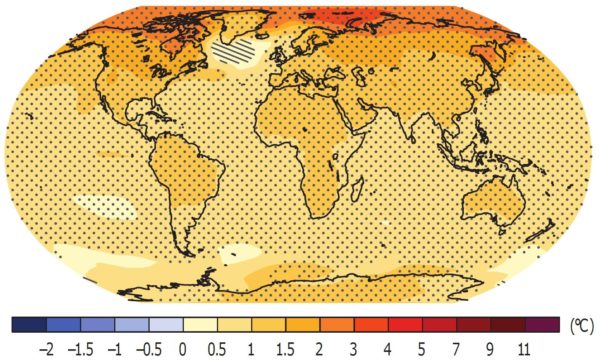
Fig. 2 Global warming from the late 20th Century to the late 21st Century (average over 32 models, RCP2.6 scenario) – Figure SPM8a of the IPCC AR5.
The IPCC writes that “hatching indicates regions where the multi-model mean is small compared to natural internal variability (i.e., less than one standard deviation of natural internal variability in 20-year means.)” The subpolar North Atlantic stands out as the only region lacking significant predicted warming even by the late 21st Century. The 4th IPCC report included a similar graph (Fig. TS28).
In our paper we have analysed the ‘historic’ runs of the CMIP5 climate models (i.e. those from preindustrial condition to the present) and found that the observed ‘cold blob’ in this region is consistent with what the models predicted, with the amount of cooling in the models depending mainly on how much the AMOC declines (see below). In the mean of the 13 models we examined (Fig. 5 of our paper), the downward trend of the AMOC index is -0.33 °C per century, in the observations we found -0.44 °C per century. (Our AMOC index simply consists of the difference between the surface temperatures of the subpolar Atlantic and the global ocean). The models on average thus predicted three quarters of the decline that the observational data indicate. (In fact most models cluster around the observed decline, but three models with almost zero AMOC decline cause the underestimation in the mean.)
Is there an alternative explanation?
If the ocean temperature in any region changes, this can only be due to a change in heat supply or loss. That can either be a change in heat flow via ocean currents or through the sea surface. Thus the subpolar Atlantic can either have cooled because the ocean currents are bringing less heat into this region, or alternatively because more heat is being lost to the atmosphere. So how do we know which of these two it is?
First, we can analyze the heat flux from ocean to atmosphere, which can be calculated with standard formula from the sea surface temperature and weather data. Halldór Björnsson of the Icelandic weather service has done this and presented the results at the Arctic Circle conference 2016 (they are not published yet). He showed that the short-term temperature fluctuations from year to year correlate with the heat exchange through the sea surface, but that this does not explain the longer-term development of the ‘cold blob’ over decades. His conclusion slide stated:
Surface heat fluxes did not cause the long term changes and are only implicated in the SST variations in the last two decades. Long term variations are likely to be oceanic transport but not due to local atmospheric forcing.
That’s exactly what one expects. Weather dominates the short-term fluctuations, but the ocean currents dominate the long-term development because of the longer response time scale and “memory” of the ocean.
Nevertheless some have suggested that the main mode of atmospheric variability in the north Atlantic, the North Atlantic Oscillation or NAO, might have caused the “cold blob”. In our paper we present a standard lagged correlation analysis of the NAO with the “cold blob” temperature (in form of our AMOC index). The result: there is indeed a significant correlation of the NAO with subpolar Atlantic surface temperatures. But on the longer time scales of interest to us (for 20-year smoothed data), changes in the sea surface temperature lead the NAO changes by three years. We conclude that changes in sea surface temperatures cause the changes in NAO and not vice versa. (And we’re certainly not the first to come to this conclusion.)
And a third point: in summer, the effect of heat flow through the sea surface should dominate, in winter the effect of ocean currents. That is because the well-mixed surface layer of the ocean is thin, so only the uppermost part of the ocean heat transport gets to affect the surface temperature. But the thin surface layer still feels the full brunt of atmospheric changes, and even stronger than in winter, because the thermal inertia of the thin summer surface layer is small. In our paper we analysed the seasonal cycle of the temperature changes in the subpolar Atlantic. The cooling in the “cold blob” is most pronounced in winter – both in the climate model (where we know it’s due to an AMOC slowdown) and in the observations. That yet again suggests the ‘cold blob’ is driven from the ocean and not the atmosphere.
There is another well-known mode of Atlantic temperature variability known as AMO, which correlates strongly with our AMOC index. Its established standard explanation in the scientific literature is… variations in the AMOC. (The NAO and AMO connections are discussed in more detail in the Extended Data section of our paper.)
There may be the possibility that some ocean heat transport change other than an AMOC change could be responsible for the ‘cold blob’ in the subpolar Atlantic, and I wouldn’t argue that we understand the ocean current changes in detail. But if you take a ‘big picture’ view, it is a fact that the AMOC is the dominant mechanism of heat transport into the high-latitude Atlantic, and the region that has cooled is exactly the region that cools in climate models when you slow down the AMOC. We have analysed the ensemble of CMIP5 “historic” model simulations for the past climate change from 1870 to 2016. For each of these model runs, we computed the AMOC slowdown over this time as diagnosed by our AMOC index (i.e. based on subpolar ocean surface temperatures) as well as the actual AMOC slowdown (which we know in the models, unlike in the real world.) The two correlate with a correlation coefficient R=0.95. Thus across the different models, differences in the amount of AMOC slowdown nearly completely explain the differences in subpolar Atlantic temperatures. If you doubt that what the temperatures in the Atlantic are telling us is a story of a slowing AMOC, you doubt not only that the high-resolution CM2.6 climate model is correct, but also the entire CMIP5 model ensemble.
A range of different data sets and analyses suggest a long-term AMOC slowdown
A number of different SST data sets and analyses support the idea of the AMOC slowdown. That is not just the existence of the subpolar cooling trend in the instrumental SST data. It is the cross-correlation with the South Atlantic performed by Dima and Lohmann. It is the fact that land-based proxy data for surface temperature suggest the cold blob is unprecedented for over a millennium. It is the exceptional SST warming off the North American coast, an expected dynamical effect of an AMOC slowdown, and strong warming off the west coast of southern Africa (see Fig. 1 in my previous post).
In addition we have the conclusion by Kanzow et al. from hydrographic sections that the AMOC has weakened by ~ 10% since the 1950s (see below). And the Nitrogen-15 data of Sherwood et al. indicating a water mass change that matches what is predicted by the CM2.6 model for an AMOC slowdown. And the subsurface Atlantic temperature proxy data published recently by Thornalley et al. Plus there is work suggesting a weakening open-ocean convection. And finally, our time evolution of the AMOC that we proposed based on our AMOC index, i.e. based on the temperatures in the cold blob region, for the past decades matches evidence from ocean reanalysis and the RAPID project. Some of these other data are shown together with our AMOC index below (for more discussion of this, see my previous post).
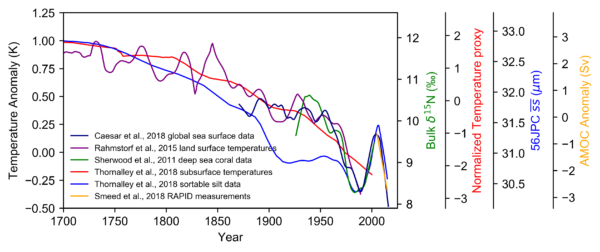
Fig. 3 Time evolution of the Atlantic overturning circulation reconstructed from different data types since 1700. The scales on the left and right indicate the units of the different data types. The lighter blue curve was shifted to the right by 12 years since Thornalley found the best correlation with temperature with this lag. Our index is the dark blue line starting in 1870. Graph: Levke Caesar.
Do measurements contradict our reconstruction?
Measuring the AMOC at a particular latitude in principle requires measuring a cross-section across the entire Atlantic, from surface to bottom. There are only two data sets that aspire to measure AMOC changes in this way. First, the RAPID project which has deployed 226 moored measuring instruments at 26.5 ° North for that purpose since 2004. It shows a downward trend since then, which closely matches what we find with our temperature-based AMOC index. Second is the work by Kanzow et al. (2010) using results of five research expeditions across the Atlantic between 1957 and 2004, correcting an earlier paper by Bryden et al. for seasonal effects and finding a roughly 10% decline over this period (in terms of the linear trend of these five data points).
Some other measurements cover parts of the overturning circulation, and generally for short periods only. For 1994-2013, Rossby et al. (2013) – at the Oleander line between 32° and 40° North – found a decrease in the upper 2000m transport of the Gulf Stream by 0.8 Sverdrup (a Sverdrup is a flow of a million cubic meters per second). It is important to realize that the AMOC is not the same as the Gulf Stream. The latter, as measured by Rossby, has a volume flow of ~90 Sverdrup, while the AMOC has a volume flow of only 15-20 Sverdrup. While the upper northward branch of the AMOC does flow via the Gulf Stream, it thus only contributes about one fifth to the Gulf Stream flow. Any change in Gulf Stream strength could thus be due to a change in the other 80% of Gulf Stream flow, which are wind-driven. The AMOC does however provide the major northward heat transport which affects the northern Atlantic climate, because its return flow is cold and deep. Most of the Gulf Stream flow, in contrast, returns toward the south near the sea surface at a similar temperature as it flowed north, thus leaving little heat behind in the north.
Likewise for 1994-2013, Roessler et al. (2015) found an increase of 1.6 Sv in the transport of the North Atlantic Current between 47° and 53° North. This is a current with a mean transport of ~27 Sverdrup, 60% of which is subtropical waters (i.e., stemming from the south via the Gulf Stream). For this period, our reconstruction yields an AMOC increase by 1.3 Sv.
For 1994-2009, using sea-level data, Willis et al. (2010) reconstructed an increase in the upper AMOC limb at 41°N by 2.8 Sv. For this period, our reconstruction yields an AMOC increase by 2.1 Sv.
Finally, the MOVE project measures the deep southward flow at 15° North. This is a flow of ~20 Sverdrup which can be considered the sum of the north Atlantic overturning circulation plus a small component of returning Antarctic Bottom Water (see Fig. 1 in Send et al. 2011). The following graph shows all these measurements together with our own AMOC index (Caesar et al 2018).
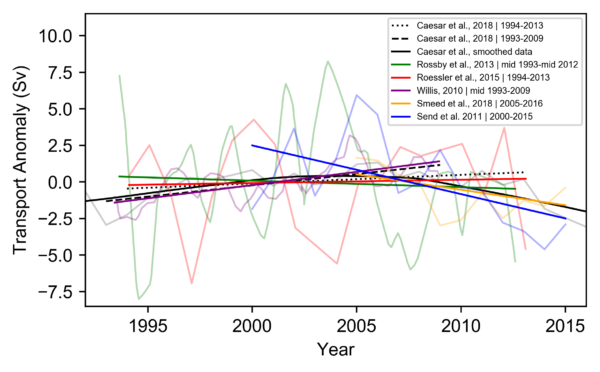
Fig 4. Our AMOC index in black, compared to five different measurement series related more or less strongly to the AMOC. The dashed and dotted linear trends of our index can be directly compared to the linear trends over corresponding data intervals. The solid black line shows our standard smoothed index as shown in our paper and in Fig. 3. Graph by Levke Caesar.
First of all, it is clear that these data contain a lot of year-to-year variability – which doesn’t correlate between the different measurements and for our purposes is just ‘noise’ and not a climate signal. That is why for our index we generally only consider the long-term (multidecadal) changes in SST to reflect changes in the AMOC. Thus, we need to look at the trend lines in Fig. 4.
Given that even these trends cover short periods of noisy data sets and thus are sensitive to the exact start and end years, and that lags between the various parts of the system may be expected, all these trends are surprisingly consistent! At least I don’t see any significant differences or inconsistencies between these various trends. Generally, the earlier trends in the left part of the graph are upward and the later trends going up to the present are downward. That is fully consistent with our reconstruction showing a low around 1990, an AMOC increase up the early 2000s and then a decline up to the present (compare Fig. 3).
Claims that any of these measurements are at odds with our index or even disprove the long-term AMOC decline are thus baseless (and thus rightly fit into Breitbart News where they were raised by the notorious James Delingpole).
One interesting question for further research is how the AMOC in the Atlantic is linked to the exchange with the Nordic Seas across a line between Greenland, Iceland and Scotland. In our 2015 paper we showed a model result suggesting an anti-correlation of these overflows with the AMOC, and our new paper suggests a similar thing: a warm anomaly off Norway coinciding with the cold anomaly in the subpolar Atlantic, both in the high-resolution CM2.6 model and the observations.
So, while there is obviously the need to understand the ocean circulation changes in the North Atlantic in more detail, I personally have no more doubts that the conspicuous ‘cold blob’ in the subpolar Atlantic is indeed due to a long-term decline of the northward heat transport by the AMOC. If you still have doubts, we’d love to hear your arguments!

 Check out what’s happened this past week in forestry news!


 Check out what’s happened this week in the world of forestry!