Transparency in climate science

Good thing? Of course.*

I was invited to give a short presentation to a committee at the National Academies last week on issues of reproducibility and replicability in climate science for a report they have been asked to prepare by Congress. My
slides give a brief overview of the points I made, but basically the issue is not that there isn’t enough data being made available, but rather there is too much!

A small selection of climate data sources is given on our (cleverly named) “Data Sources” page and these and others are enormously rich repositories of useful stuff that climate scientists and the interested public have been diving into for years. Claims that have persisted for decades that “data” aren’t available are mostly bogus (to save the commenters the trouble of angrily demanding it, here is a link for data from the original hockey stick paper. You’re welcome!).

The issues worth talking about are however a little more subtle. First off, what definitions are being used here. This committee has decided that formally:

  • Reproducibility is the ability to test a result using independent methods and alternate choices in data processing. This is akin to a different laboratory testing an experimental result or a different climate model showing the same phenomena etc.
  • Replicability is the ability to check and rerun the analysis and get the same answer.

[Note that these definitions are sometimes swapped in other discussions.] The two ideas are probably best described as checking the robustness of a result, or rerunning the analysis. Both are useful in different ways. Robustness is key if you want to make a case that any particular result is relevant to the real world (though that is necessary, not sufficient) and if a result is robust, there’s not much to be gained from rerunning the specifics of one person’s/one group’s analysis. For sure, rerunning the analysis is useful for checking the conclusions stemmed from the raw data, and is a great platform for subsequently testing its robustness (by making different choices for input data, analysis methods, etc.) as efficiently as possible.

So what issues are worth talking about? First, the big success in climate science with respect to robustness/reproducibility is the Coupled Model Intercomparison Project – all of the climate models from labs across the world running the same basic experiments with an open data platform that makes it easy to compare and contrast many aspects of the simulations. However, this data set is growing very quickly and the tools to analyse it have not scaled as well. So, while everything is testable in theory, bandwidth and computational restrictions make it difficult to do so in practice. This could be improved with appropriate server-side analytics (which are promised this time around) and the organized archiving of intermediate and derived data. Analysis code sharing in a more organized way would also be useful.

One minor issue is that while climate models are bit-reproducible at the local scale (something essential for testing and debugging), the environments for which that is true are fragile. Compilers, libraries, and operating systems change over time and preclude taking a code from say 2000 and the input files and getting exactly the same results (bit-for-bit) with simulations that are sensitive to initial conditions (like climate models). The emergent properties should be robust, and that is worth testing. There are ways to archive the run environment in digital ‘containers’, so this isn’t necessarily always going to be a problem, but this has not yet become standard practice. Most GCM codes are freely available (for instance, GISS ModelE, and the officially open source DOE E3SM).

There is more to climate science than GCMs of course. There are operational products (like GISTEMP – which is both replicable and reproducible), and paleo-climate records (such as are put together in projects like PAGES2K). Discussions on what the right standards are for those projects are being actively discussed (see this string of comments or the LiPD project for instance).

In all of the real discussions, the issue is not whether to strive for R&R, but how to do it efficiently, usably, and without unfairly burdening data producers. The costs (if any) of making an analysis replicable are borne by the original scientists, while the benefits are shared across the community. Conversely, the costs of reproducing research is borne by the community, while benefits accrue to the original authors (if the research is robust) or to the community (if it isn’t).

One aspect that is perhaps under-appreciated is that if research is done knowing from the start that there will be a code and data archive, it is much easier to build that into your workflow. Creating usable archives as an after thought is much harder. This lesson is one that is also true for specific communities – if we build an expectation for organized community archives and repositories it’s much easier for everyone to do the right thing.

[Update: My fault I expect, but for folks not completely familiar with the history here, this is an old discussion – for instance, “On Replication” from 2009, a suggestion for a online replication journal last year, multiple posts focused on replicating previously published work (e.g.) etc…]

* For the record, this does not imply support for the new EPA proposed rule on ‘transparency’**. This is an appallingly crafted ‘solution’ in search of a problem, promoted by people who really think that that the science of air pollution impacts on health can be disappeared by adding arbitrary hoops for researchers to jump through. They are wrong.

** Obviously this is my personal opinion, not an official statement.

The Importance of Forest Policy Coalitions

May 9th, 2018|Tags: , , |0 Comments

.fusion-fullwidth-4 {
padding-left: px !important;
padding-right: px !important;
}

By Rebecca Turner, Senior Director of Programs and Policy

Rebecca Turner, senior director of programs and policy, meets with coalition members at a recent reception celebrating the Fire Funding Fix in the FY19 omnibus bill.

Prior to my time at American Forests, I was a mediator of environmental law and policy conflicts. As a third-party neutral facilitator, I made sure the parties in conflict came together, heard each other’s concerns, created consensus on how to overcome those conflicts and work together to reach their shared goal. I left mediation to pursue a career more squarely in advocacy, because, truthfully, I am not naturally a neutral person. I am more interested in persuading decision makers to develop and adopt policies that are based in science for protecting and restoring our forests. Here at American Forests, I get to do just that.

However, the skills I developed as a mediator are used just as much as my advocacy skills, because our policy work is best done in collaboration with other organizations seeking the same goals for our forests. And when multiple parties come together around a common goal, there is still a need for consensus-based problem solving.  While each group participating has the larger goal in common, ideas on how that goal should be reached is often not the same. So we work together to come to agreement. That process takes time, trust, and often a bit of mediation.

So why do we do it?  If American Forests knows how it wants to reach its goals, why don’t we go it alone? Well, sometimes we do. But more often than not, the power of the coalition is much stronger and more effective in achieving the desired outcomes.  When a group of interested parties, from across the forestry field choose to work together to provide policy makers with a consensus-based set of recommendations, the probability is much higher of those recommendations being enacted, like the recent Fire Funding Fix.

I am not the only one at American Forests who works with coalitions. In fact many of us at American Forests are leaders of coalitions and working groups, helping to bring the forestry conservation field to consensus on important issues facing our forests – best urban forestry practices in a city, restoring the whitebark pine across its range, finding forest-climate solutions. In all of these we practice “servant-leadership,” a term coined by Robert Greenleaf in the 1970s.

The servant-leader is servant first and true leadership emerges from those whose primary motivation is a deep desire to help others.

Servant leadership emphasizes increased service to others, a holistic approach to work, promoting a sense of community, and the sharing of power in decision making. The words servant and leader are usually thought of as being opposites. When two opposites are brought together in a creative and meaningful way, a paradox emerges. So the words servant and leader have been brought together to create the paradoxical idea of servant-leadership. (Spears, Larry. Practicing Servant-Leadership, Leader to Leader, No. 34 Fall 2004)

It is through this mentality that we at American Forests approach our work in coalitions and in our organization.

The post The Importance of Forest Policy Coalitions appeared first on American Forests.

Climate indicators

The climate system is complex, and a complete description of its state would require huge amounts of data. However, it is possible to keep track of its conditions through summary statistics.

There are some nice resources which give an overview of a number for climate indicators. Some examples include NASA and The Climate Reality Project.

The most common indicator is the atmospheric background CO2 concentration, the global mean temperature, the global mean sea level, and the area with snow or Arctic sea ice. Other indicators include rainfall statistics, drought indices, or other hydrological aspects. The EPA provides some examples.   

One challenge has been that the state of the hydrological cycle is not as easily summarised by one single index in the same way as the global mean temperature or the global mean sea level height. However, Giorgi et al. (2011) suggested a measure of hydro-climatic intensity (HY-INT) which is an integrated metric that captures the precipitation intensity as well as dry spell length.  

There are also global datasets of indices representing the more extreme aspects of climate called CLIMDEX, providing a list of 27 core climate extremes indices (so-called the ‘ETCCDI’ indices, referring to the ‘CCl/CLIVAR/JCOMM Expert Team on Climate Change Detection and Indices’).

In addition, there is a website hosted by the NOAA that presents various U.S. Climate Extremes Index (CEI) in an interactive way.

So there are quite a few indicators for various aspects of the climate. One question we should ask, however, is whether they capture all the important and relevant aspects of the climate. I think that they don’t, and that there are still some gaps.


Perhaps there is room for more indicators inspired by the “big picture physics”, such as the planetary energy balance and the outgoing long-wave radiation (OLR). An increased greenhouse effect means that the atmosphere becomes more opaque for infra-red radiation (IR), while the visible light that heats the surface is unaffected.

The heat loss from a planet happens through IR radiation, since space is virtually a vacuum where energy is only transmitted though electromagnetic waves. If one could see the IR light, an opaque atmosphere would make the pattern of emitted IR diffuse since only the IR from the upper levels of the atmosphere escape to space after it has been absorbed and re-emitted by the greenhouse gases (this of course depends on the wavelength of the IR and the absorption spectrum, but we can use this assumption for heat loss integrated over the whole IR spectrum).

The figure below shows the mean IR estimated from the 2-meter temperature according to Q=\sigma T_{2m}^4 (upper), the OLR measured by satellites (middle), and their difference.

Long-wave radiation estimated for surface temperatures according to Stefan-Boltzman’s law (upper), measured by satellites (middle) and the difference between the two (lower). (source code olr.R; PDF)

Hence, we would expect to see increasing differences in the spatial OLR structure compared to that of the heat emission from the surface, as the greenhouse effect is increased. One index capturing this could be the correlation between the spatial patterns in OLR and the surface IR flux over time (figure below taken from Benestad (2016)). 

Trend in pattern correlation between outgoing long-wave radiation (OLR) measured by satellites and calculated for surface temperatures. A decrease in the spatial correlation is consistent with the atmosphere more opaque in terms of IR.

Another index for the state of the climate and the hydrological cycle could be an metric for the global atmospheric overturning: how much air ascends and descends.

The vertical motion in the atmospheric plays a role in moving heat and moisture to greater heights, and influences both rain patterns and the OLR. One indicator could be variance in the vertical velocity w 
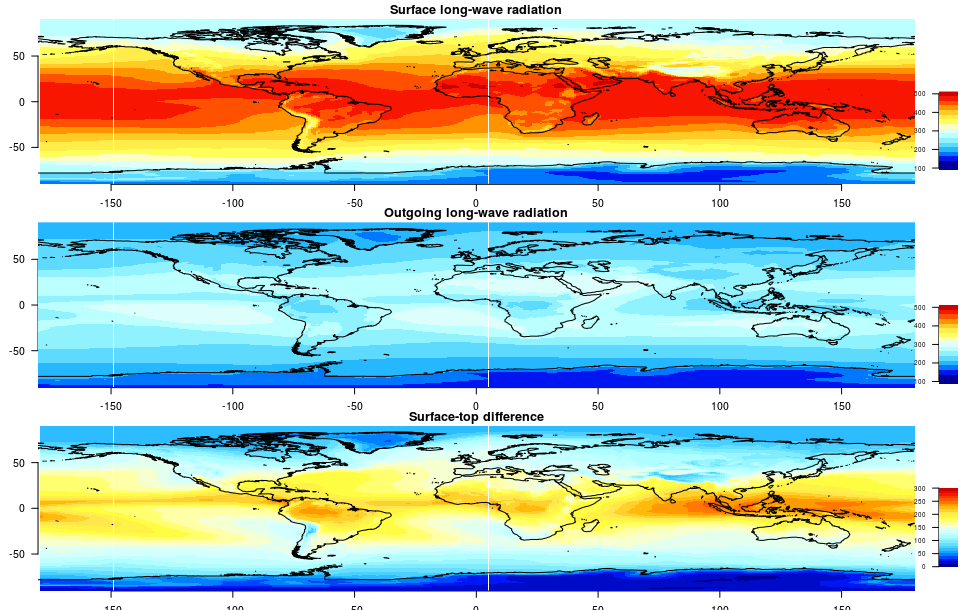
over space estimated over i=1,...,n grid-boxes, each with area a_i: W=\sum_i^n (a_i w_i - \overline{a w})^2/n  

Trends in global variance of vertical flow over space for three different height intervals in the atmosphere. An increase in the vertical motion of the mid-troposphere is consistent with more convection and increased heat flow through convection. It is likely that this has affected the clouds. The vertical motion w is labelled as v_z 
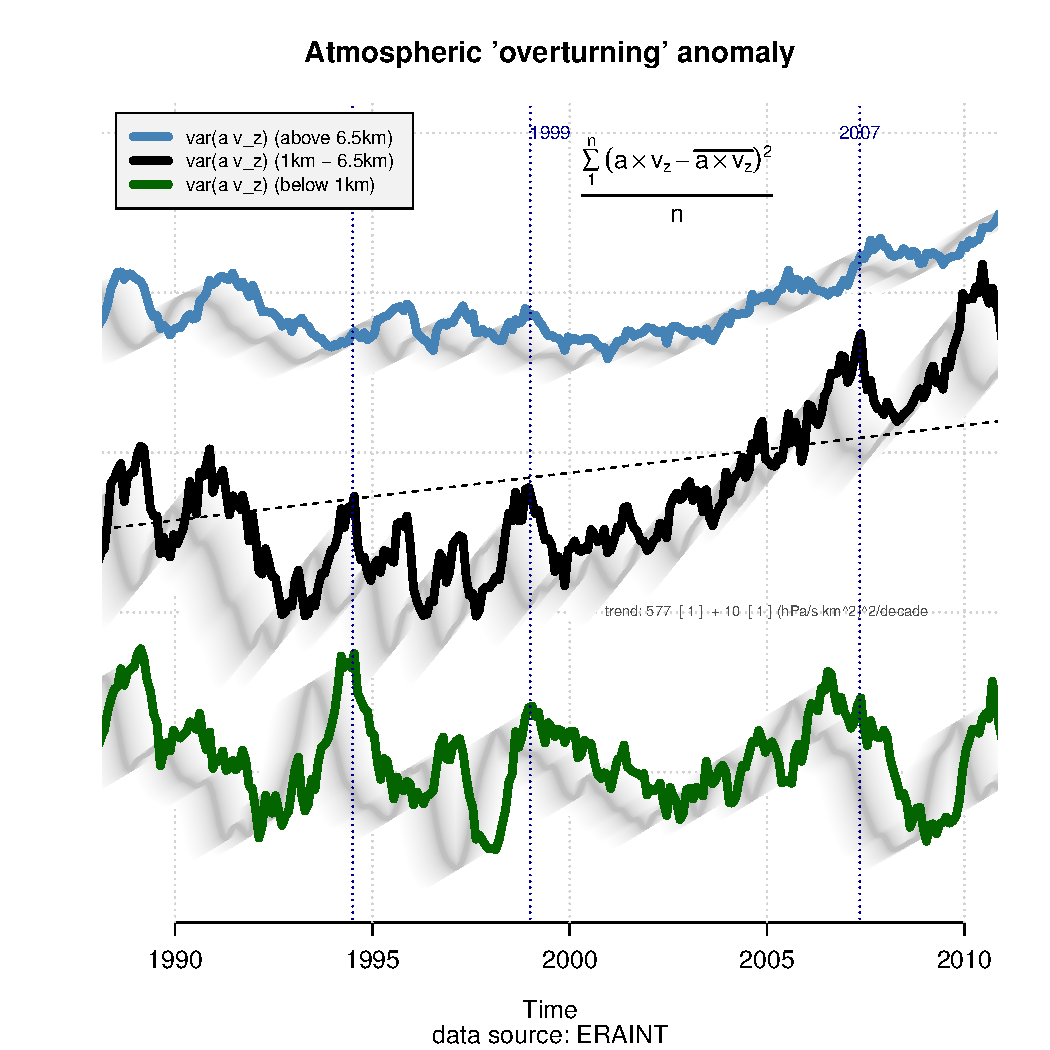
in the figure (Source: Benestad (2016),PDF)

We can estimate the atmospheric overturning W from reanalyses which provide data on the flow over a range of vertical levels and on a global scale. According to the figure above, there has been an increase in the global overturning indicator for the middle atmosphere (between 1 and 6.5 km above the surface).

The overturning indicator for the lower boundary layer, characterised by turbulence, shows a different trend to that in the middle troposphere. There is also less pronounced vertical motions in the upper part of the troposphere.

Another indicator could be the height of the region where the temperature is 254K (the 254K isotherm), which can be taken as a crude proxy for the average depth of the atmosphere from which the average heat escapes (Benestad (2016)).

A neglected indicator, which I think should be an obvious one, is the daily precipitation area A_P. This indicator has a profound meaning for the hydrological cycle and is relevant for the question of flood risk and droughts.

The mean precipitation taken over area with precipitation for any given day can be considered as the wet-day mean precipitation and provides an indicator for the mean precipitation intensity.

The mean precipitation intensity is related to the mean evaporation and is proportional to the ratio of the areas of evaporation and rainfall: \mu = (A_E/A_P)  \overline{E} 

There is a kind of a “funnel effect” since the evaporated water over a large area has to come down as precipitation over a significantly smaller area. This is a bit like the action of a funnel (see figure below) where the water moves more slowly at the top where the cross-section area is greater than at the bottom with a small cross-section.

The differences in the area of evaporation and precipitation has a similar effect as a funnel: if the mean evaporation over a large area A_E is returned a smaller A_P, then the mean intensity is amplified by the factor of A_E/A_P.

It is possible to get an estimate of the semi-global precipitation area from satellite observations (Benestad, 2018). The figure below indicates that the area with daily rain between 50S-50N has decreased by 7% since 1998, which implies that the rain has become more intense and concentrated over a smaller region.

The area between 50S and 50N (77% of Earth’s surface area) with precipitation estimated from the TRMM data. A reduction in the precipitation area implies higher mean precipitation intensity, and may be linked to changes in the atmospheric overturning presented above. (Source: Benestad (2018))

There may be other climate indicators that I have missed. Nevertheless, I hope there will be more discussions about climate indicators and more resources in the future that can offer up-to-date information about the state of the climate, based on these. Such sites could offer both graphical presentations and the actual numbers.

References


  1. F. Giorgi, E. Im, E. Coppola, N.S. Diffenbaugh, X.J. Gao, L. Mariotti, and Y. Shi, “Higher Hydroclimatic Intensity with Global Warming”, Journal of Climate, vol. 24, pp. 5309-5324, 2011. http://dx.doi.org/10.1175/2011JCLI3979.1


  2. R.E. Benestad, “A mental picture of the greenhouse effect”, Theoretical and Applied Climatology, vol. 128, pp. 679-688, 2016. http://dx.doi.org/10.1007/s00704-016-1732-y


  3. R.E. Benestad, “Implications of a decrease in the precipitation area for the past and the future”, Environmental Research Letters, vol. 13, pp. 044022, 2018. http://dx.doi.org/10.1088/1748-9326/aab375

Forest Digest: May 6, 2018

May 6th, 2018|Tags: , , , , , |0 Comments

.fusion-fullwidth-1 {
padding-left: px !important;
padding-right: px !important;
}

Check out what’s happened this past week in forestry news!

Urban Tiny Forests Are Good for BiodiversityScience and Technology Research News

Seven small city forests were planted in the Netherlands in an attempt to achieve as much biodiversity as possible. Researchers are looking at the impacts these tiny forests have on factors like air quality and heat management, with hopes to increase the number of miniature forests in the future.

Can you picture a world without forests?EnvironmentGuru

This video from the United Nations relays some of the many benefits forests provide us. The UN Strategic Plan for Forests 2030 aims to increase forest area through sustainable management and halting and reversing deforestation.

Green Champions: Five Takeaways from Conversations with Sustainability LeadersTriplePundit

Hear from worldwide business leaders on what it means to be sustainable and how to operate a business in a way that’s conscious of the environment.

How deforestation creates heat waves in North America and EuropeAnthropocene

A new study shows that deforestation has led to increases in the yearly maximum temperature across the globe, with North America and Eurasia feeling the strongest effects.

The post Forest Digest: May 6, 2018 appeared first on American Forests.

Nenana Ice Classic 2018

Another year, another ice out date. As in previous years, here’s an update of the Nenana Ice Classic time series (raw date, and then with a small adjustment for the calendrical variations in ‘spring’). One time series doesn’t prove much, but this is of course part of a much larger archive of phenomenological climate-related data that I’ve talked about before.

This year the ice on the Tanana River went out on May 1st, oddly enough the same date as last year, after another very warm (but quite snowy) Alaskan winter.

My shadow bet on whether any climate contrarian site will mention this dataset remains in play (none have since 2013 which was an record late year).

Forest Digest: April 29, 2018

April 29th, 2018|Tags: , , |0 Comments

.fusion-fullwidth-1 {
padding-left: px !important;
padding-right: px !important;
}

Credit: Scott Davenport

Check out what’s happened this week in forestry news!

If Congress Doesn’t Act, Environmentalists Worry Conservation Fund Will Dry UpWOSU Public Media

The Land and Water Conservation Fund is instrumental in preserving natural spaces, but without action from Congress, it will expire later this year.

Global timber trafficking harms forests and costs billions of dollars – here’s how to curb itThe Conversation

Assistant Professor Kenneth Wallen believes social science is one way timber trafficking can be controlled. He proposes showing the public the damage illegal timber trade causes to humans and forests, and stigmatizing the sale and purchase of contraband wood products to curb the illegal timber trade.

Miracle Alert: These Plants Will Help You Sleep BetterArchitectural Digest

Tossing and turning? Bring some of this greenery into your house for a good night’s rest.

Billions of gallons of water saved by thinning forestsScience Daily

California’s dense forests may be harming its water system through excessive evapotranspiration, the process by which plants emit water absorbed from the ground, through tiny pores in their leaves. This is particularly troubling during prolonged, warm droughts. The solution may be using managed fires to thin forests.

We calculated how much money trees save for your cityThe Conversation

This team looked at 10 megacities around the world to calculate the benefits of tree canopy cover, including the ability to reduce flooding, improve air quality, reduce pollution and more.

The post Forest Digest: April 29, 2018 appeared first on American Forests.

6 Great Hiking Trails to Get You Back into the Spring of Things

April 25th, 2018|Tags: , , |0 Comments

.fusion-fullwidth-1 {
padding-left: px !important;
padding-right: px !important;
}

By Leah Rambadt, American Forests

As the weather gets warmer, you’ll probably look for activities that let you stay outside longer and let you enjoy nature. Here are some hiking trails that’ll help you get psyched for spring and the outdoors!

For those who aren’t hiking enthusiasts, let’s define the three types of trails that are listed below:

  • Loop Trail: Brings you back to your starting point without walking on the same path.
  • Point-to-Point Trail: Designed for you to walk from one place to another, and is too long to return to the starting point.
  • In and Out (or Out and Back) Trail: You follow the trail to its end, and then walk back the same way to the starting point.

Hite Cove Trail, California

Hites Cove Trail in Yosemite

The first two miles of the trail features wildflower views from March through mid-May. Credit: Bernadine Diele/alltrails.com

Difficulty: Hard

Distance: 6.5 miles

Elevation Gain: 980 feet

Best Time to Use: Accessible year-round (wildflower walk: March–mid-May)

Hite Cove Trail is located near Mariposa, California. It’s an out and back trail that leads down to the abandoned Hite Cove mining settlement. The trail is accessible year-round, and used for hiking, walking, nature trips and birding.

Lily Mountain Trail, Colorado

Lily Mountain Trail in Colorado

Check out interesting geological features as you climb up Lily Mountain Trail. Credit: Gary Tindall/alltrails.com

Difficulty: Moderate

Distance: 3.6 miles

Elevation Gain: 1240 feet

Best Time to Use: March–September

Lily Mountain Trail is an out and back trail located near Estes Park, Colorado. It’s used for hiking, walking, nature trips and birding, and you’ll also see beautiful wildflowers. The first part of the trail is a gradual climb through pine forests, which then steepens as you climb the mountain. It goes over the summit, though the last ¼ mile of the trail may be harder to follow. From the summit, you can see Longs Peak, Estes Park and Twin Sisters Peak.

Battle Creek Falls Trail, Utah

Battle Creek Falls in Utah

The trail’s difficulty increases after crossing Battle Creek on a small, wooden bridge, as the trail narrows and steepens. Credit: Tracee Brown/alltrails.com

Difficulty: Moderate

Distance: 2.9 miles

Elevation Gain: 1236 feet

Best Time to Use: March–October

This out and back trail is located near Pleasant Grove, Utah. It follows Battle Creek as it goes up the canyon, and you can choose to continue past Battle Creek Falls. You’ll see a couple of more waterfalls, and enter a steep climb that reaches a junction where you can transfer onto Curley Springs Trail and head towards Dry Creek Canyon.

Alum Cave Trail to Mount LeConte, Tennessee

Alum Cave Trail has interesting geological features, such as Arch Rock. Credit: Dwayne Allen/alltrails.com

Difficulty: Hard

Distance: 10 miles

Elevation Gain: 2854 feet

Best Time to Use: March–November

Alum Cave Trail is located near Twin Creeks, Tennessee. It’s an out and back trail that features views of Little Duck Hawk Ridge, The Eye of the Needle and Myrtle Point. There is also a lodge and cabins near the top of the mountain – if you’re interested, you can make a reservation and stay the night!

Pine Creek Trail, Pennsylvania

Pine Creek Trail in Pennsylvania

Wildflowers blooming along Pine Creek trailside. The trail is well-maintained and covered with finely crushed limestone. Credit: PJ Wetzel/alltrails.com

Difficulty: Easy

Distance: 61.6 miles

Elevation Gain: 908 feet

Best Time to Use: March–November

This point-to-point trail is located near Wellsboro, Pennsylvania. It has numerous trailheads, comfort stations, campgrounds and small towns along the route, which allows you to plan for short and long excursions. There are many access points to the trail with parking lots that you can use.

Bear Lake Trail, Florida

Bear Lake Trail in Florida

Bear Lake Trail takes you through pine flatwoods and bluff forests full of southern magnolia and hickory trees. Credit: Jason Flynn/alltrails.com

Difficulty: Easy

Distance: 3.7 miles

Elevation Gain: 55 feet

Best Time to Use: Year-round

This is a loop trail that’s good for all skill levels. It’s located near Munson, Florida, and goes around an impounded reservoir that flows into Sweetwater Creek. In addition to hiking, it’s also an excellent spot for birding. You may see a swallow-tailed kite on your hike!

Remember, these are just suggested hiking trails to get you started. Choose any trail you’d like, close by or far away, and hike out!

Also, if you share #WhyIHike with our partner, Eddie Bauer, you could win one of three hiking destinations!

The post 6 Great Hiking Trails to Get You Back into the Spring of Things appeared first on American Forests.

Assessing Your Urban Forest with Vibrant Cities Lab

April 25th, 2018|Tags: , |0 Comments

.fusion-fullwidth-8 {
padding-left: px !important;
padding-right: px !important;
}

By Ian Leahy, Director of Urban Forest Programs

One of the most dynamic aspects of the new hub of urban forestry expertise, Vibrant Cities Lab, might not be readily apparent to those who haven’t explored the site’s many nooks and crannies: the Community Assessment and Goal-Setting Tool.

This self-assessment tool is accessible in two places: toward the bottom of the Urban Forestry Toolkit main page and in Step 17 of that toolkit. It is a great resource for urban forestry professionals trying to build their program, for city managers learning about what it takes to build an urban forestry program, or for community advocates looking to provide structure and goals around which to build support.

The Tool is based on 28 criteria that were developed by academic researchers to define what an ideal urban forest management program includes. These criteria range from arboricultural objectives, such as age and species distribution, to more social aspects of urban natural resource management, such as inter-agency coordination and public awareness.

The tool walks users through each criterion, providing a point-based system for self-assessing where their own community stands. For example, if your town or city has no urban tree canopy assessment, you select negative one point for that question. Lacking such data is not only not helping your cause, it is actively working against you. Likewise, if you have conducted a low-resolution assessment using a free tool like i-Tree, give yourself two points. Investing in a high-resolution assessment with clear implementation goals is worth three points. And if that assessment is being actively used rather than sitting on a shelf collecting dust, then you can give yourself the maximum four points.

You then set a realistic goal for that criterion which you think your community can reach within a timeline of your choosing. For example, if you’ve done an i-Tree assessment, but would like to partner with a university to develop a Lidar imagery assessment as the foundation for a robust action plan, you would give yourself two points in the “Current” column and four points in the “Goal” column. The tool will track the gap score between the two columns as you work through every criteria necessary to build a robust urban forestry program.

When you’ve assessed your urban forest for all criteria, the tool will give you an overall final score, as well as one for each topic. You can save your completed assessments by either creating a free account or logging in with an i-Tree account. Each assessment you complete can be added to your profile, making it easy to track your progress toward closing that gap score.

We designed the Community Assessment and Goal-Setting Tool so you control the information. We want city foresters and managers to be comfortable using the tool to make strategic decisions about where to prioritize funding and technical expertise without being held publicly accountable for how their city might match up to comparable cities. American Forests also worked closely with the Arbor Day Foundation and other urban forestry partners to ensure the criteria aligned with their work.

Vibrant Cities Lab is a free product of American Forests, the U.S. Forest Service and the National Association of Regional Councils that launched in late 2017. It is a platform to deliver urban forestry expertise to the decision-makers who most impact tree canopy. New content can be submitted through the contact form for consideration by an advisory board’s review process.

The post Assessing Your Urban Forest with Vibrant Cities Lab appeared first on American Forests.