If you think you know why NASA did not report the discovery of the Antarctic polar ozone hole in 1984 before the publication of Farman et al in May 1985, you might well be wrong.
One of the most fun things in research is what happens when you try and find a reference to a commonly-known fact and slowly discover that your “fact” is not actually that factual, and that the real story is more interesting than you imagined…
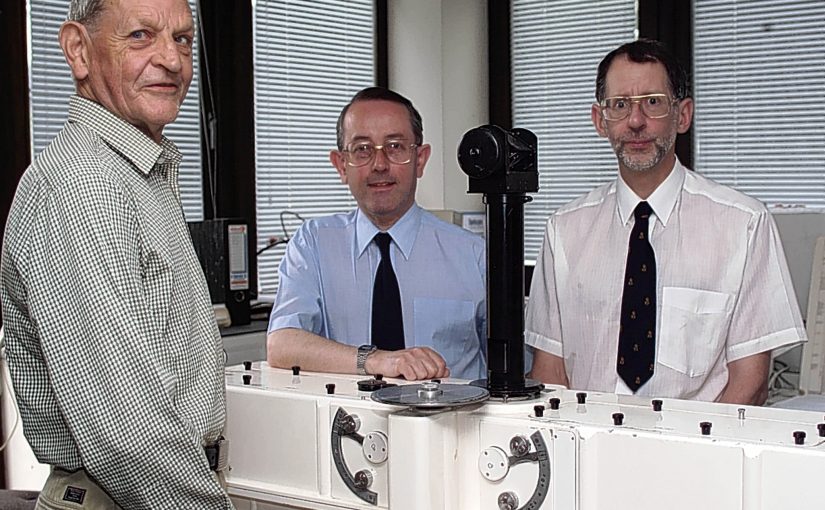
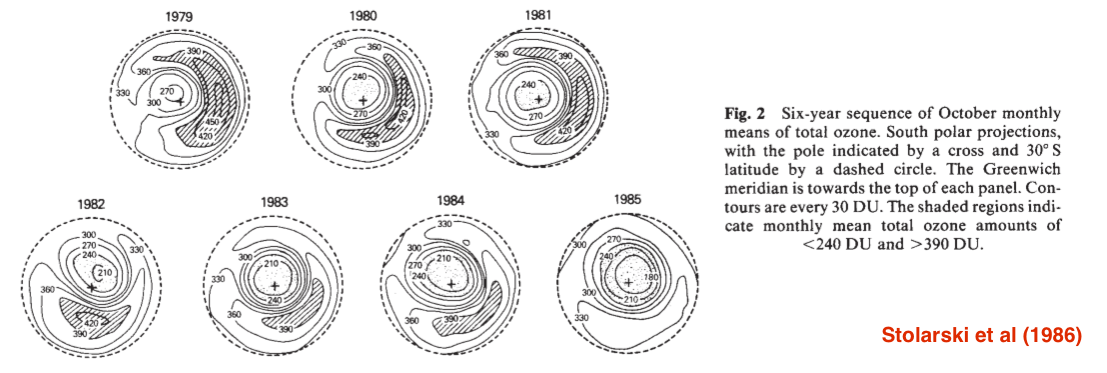
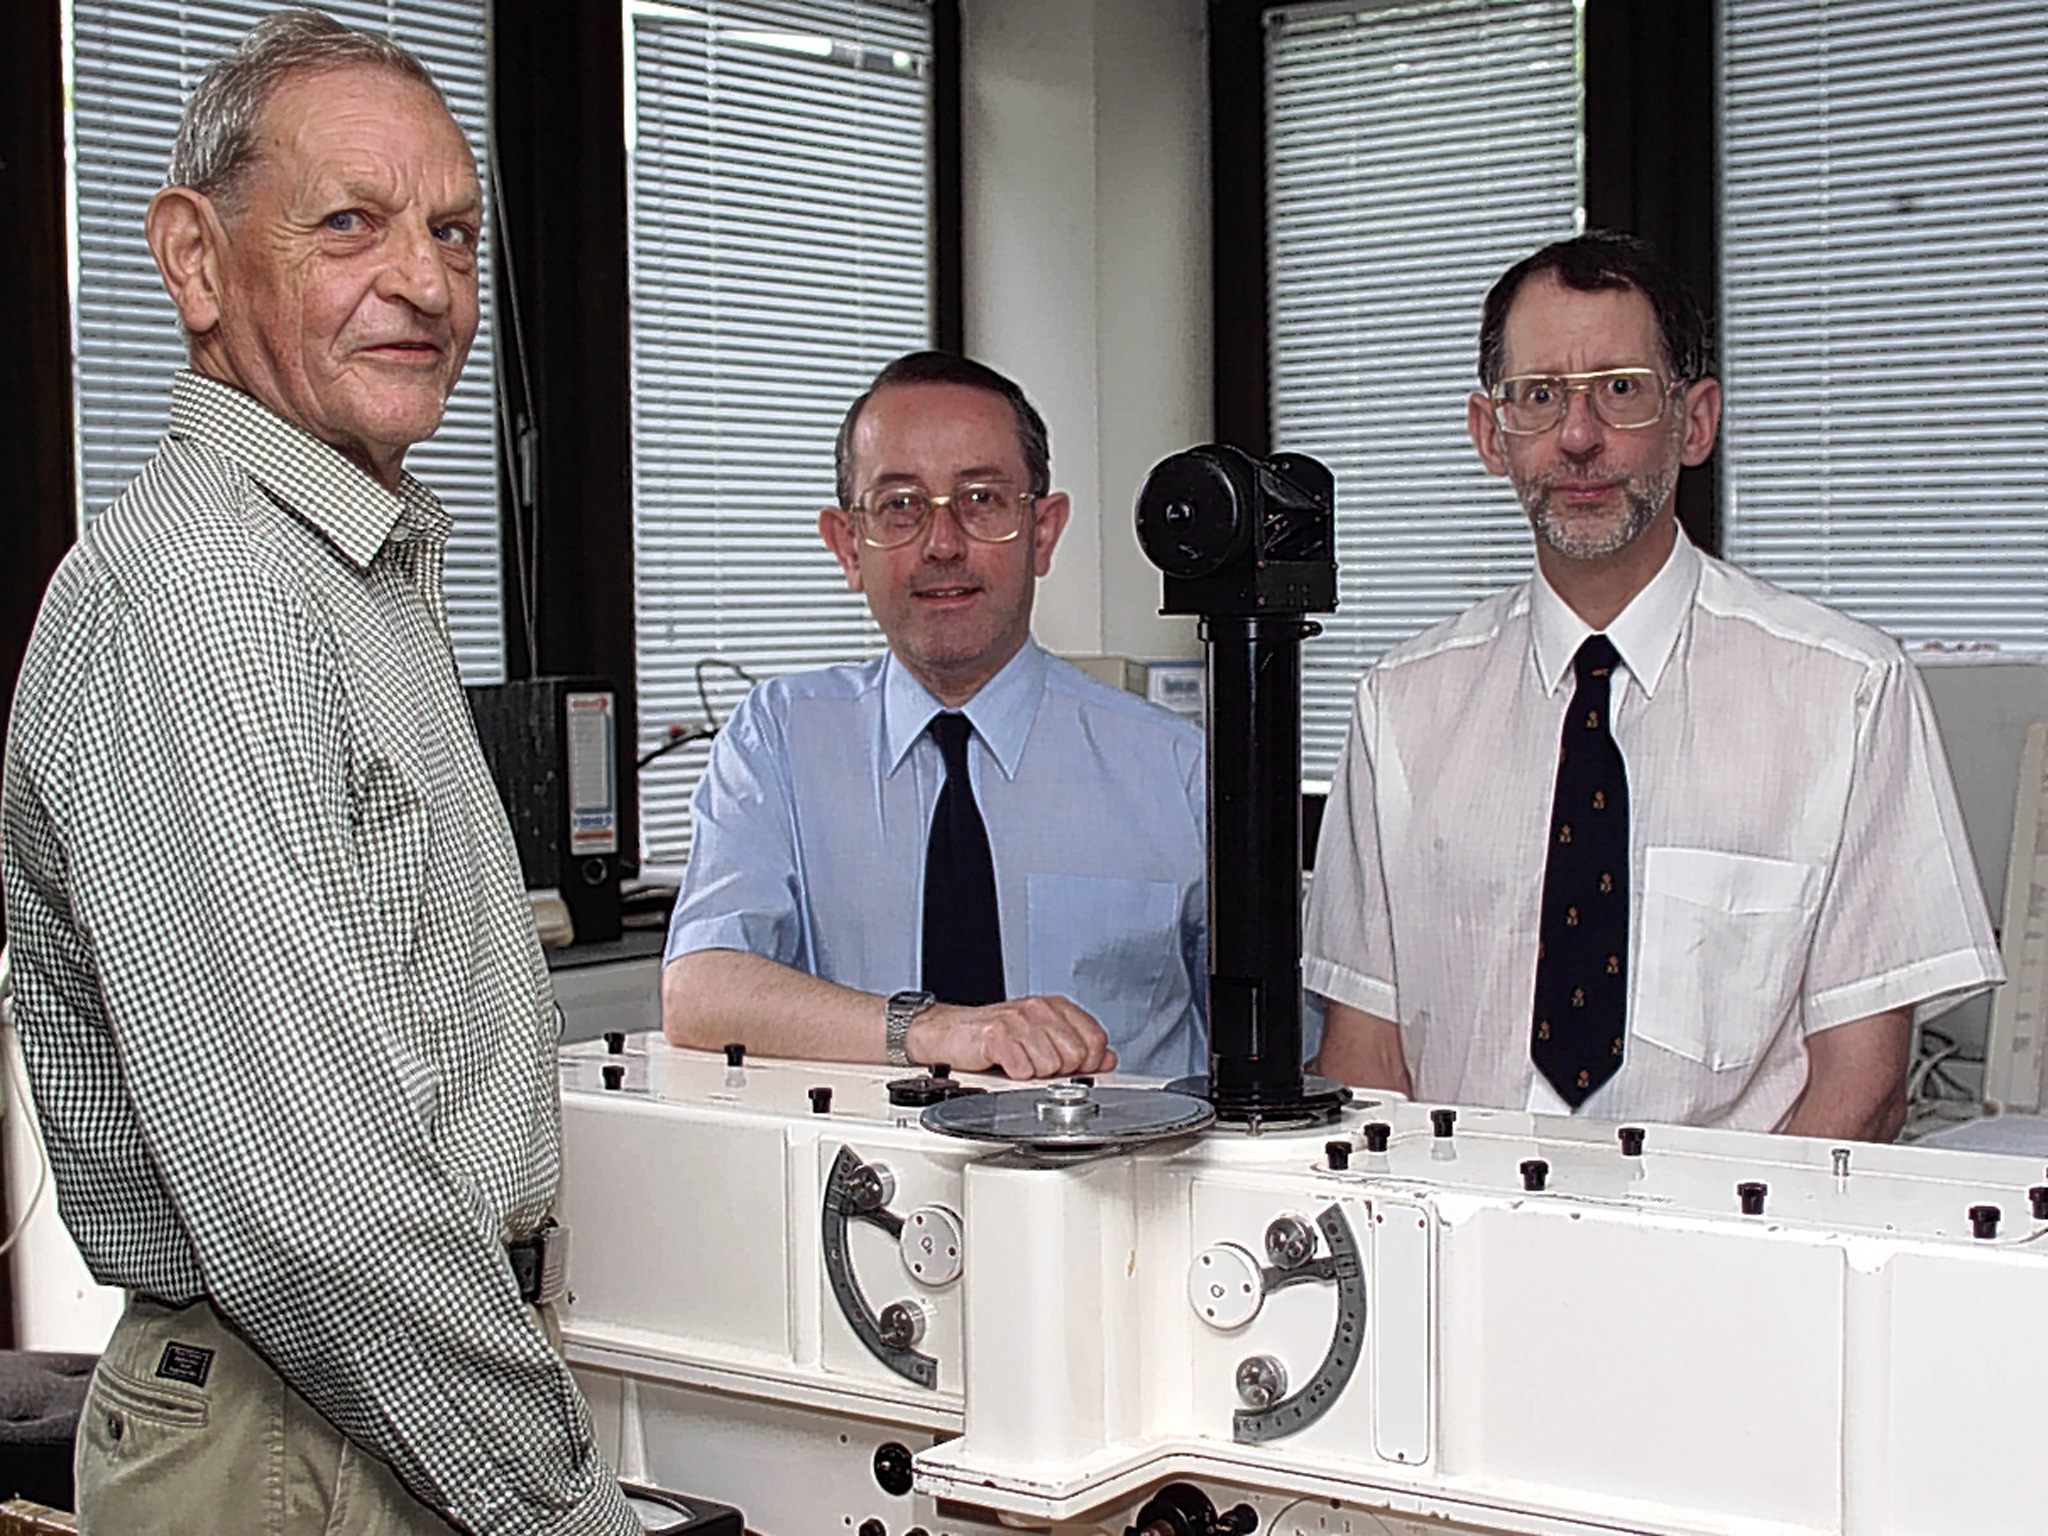 Here is the standard story (one I’ve told repeatedly myself): The publication in 1985 by scientists from the British Antarctic Survey working at Halley Station (right) of observations of extremely low ozone values in Oct 1983 (SH springtime) came as a huge shock to the scientific community. Given that NASA had been monitoring ozone by satellite using the NIMBUS instruments since the late 1970s, people were surprised that this had not been reported already. NASA scientists went back to the satellite data and found that anomalously low values had been rejected as bad data and were not included in the analyses. After reprocessing the data with this flag removed, the trends became clear and the confirmation of ground-based data was reported in the NY Times in Nov 1985 and published formally the next year (Stolarski et al., 1986).
This is mostly true, but not quite…
It is true that the Quality Control (QC) flag on the retrieval was set whenever the inferred ozone level dropped below 180 Dobson Units [1 DU is equivalent to a 0.01mm thick pure ozone layer at standard temperature and pressure]. Prior to 1983, there had never been an observation below 200 DU and so values lower than 180 DU were out of calibration range for the sensor. These calibrations rely on the actual atmospheric profiles being relatively close to pre-defined standards so that deviations in the observed radiances are small, and you can assume quasi-linearity. Deviations that are too large can come from multiple causes and thus are more uncertain to interpret. The absence of a very low ozone profile in the calibration was thus inherently limiting.
However, it wasn’t true that no-one at NASA had noticed.
Satellite anomalies
The processing of the Oct 1983 data was started in August 1984 by the Ozone Processing Team at Goddard Space Flight Center led by A. Fleig and including Donald Heath and P.K. Bhartia. In statements from Bhartia and Richard McPeters, it seems clear that the large increase in flagged data (points that were nominally below the QC level) in October 1983 was noticed and investigated. The first explanation for a large increase in anomalous data is almost always that there is something wrong with the sensor, and the first check on that is comparing the retrievals with whatever ground truth is available. The only publically available real-time Antarctic ozone data at the time was from South Pole (the BAS data was not publically accessible), and that showed polar ozone values of ~300 DU in Oct 1983, casting doubt on the anomalously low satellite retrievals. Nonetheless, retrieved values from the rest of the world outside of the polar vortex were normal so the puzzle remained. Additional data had been available from the Japanese Syowa station for 1982 which would have been helpful, but its publication (in December 1984) was not widely appreciated at the time.
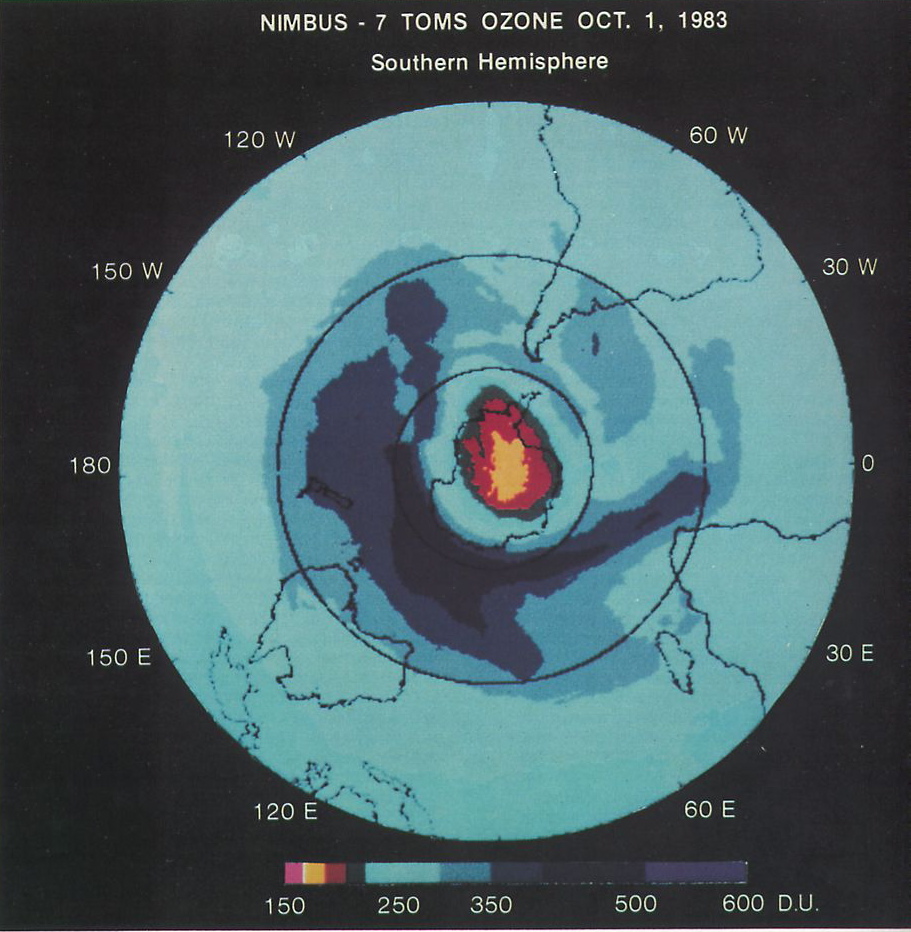
By December 1984, the OPT team was confident enough that the data was real that they submitted an abstract for a conference to be held in Prague in August 1985. The title was “Observation of anomalously small ozone densities in south polar stratosphere in October 1983 and pre-1984” (P.K. Bhartia et al) and the data that they’d generated (in 1984) included the following map:
However, before this had been publically presented, the Farman et al paper was published in Nature in May 1985.
Halley Station reports
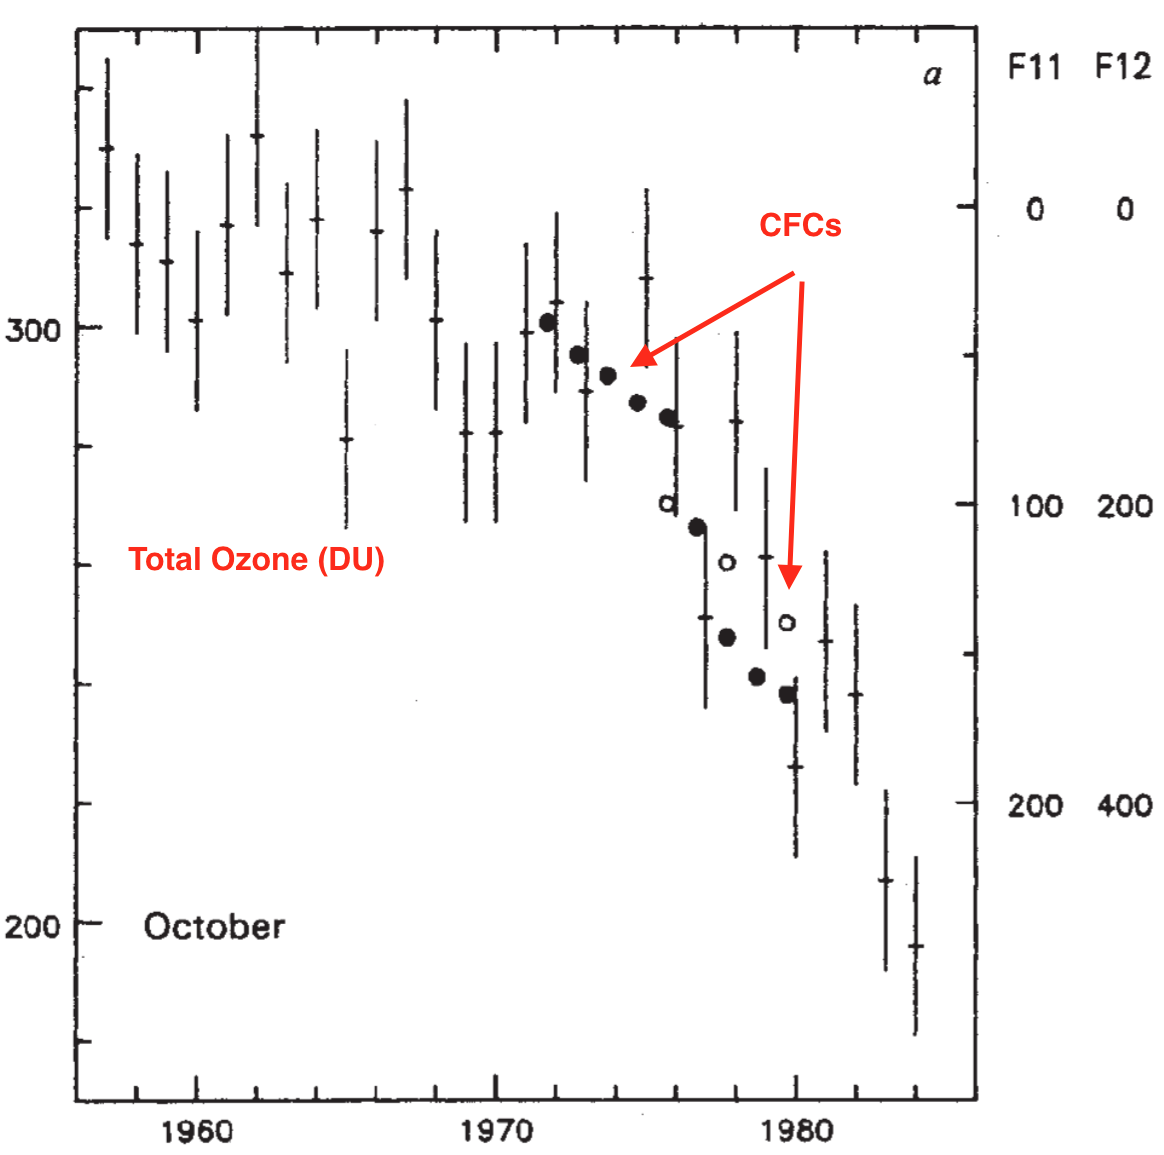
The clear decrease in October ozone values seen at Halley Station (in 1983, falling below 200 DU for the first time), and the correlation to the increasing CFC concentrations (plotted inversely in the figure above), was undoubtedly dramatic.
It wasn’t however until Nov 1985 after a workshop that the first media report (in the NY Times) showed the NASA results (publishing another Oct 1983 map for a slightly different day). That article was notably the first public use the term “hole” to describe the feature (though this term had been coined by Sherwood Rowland some months earlier).
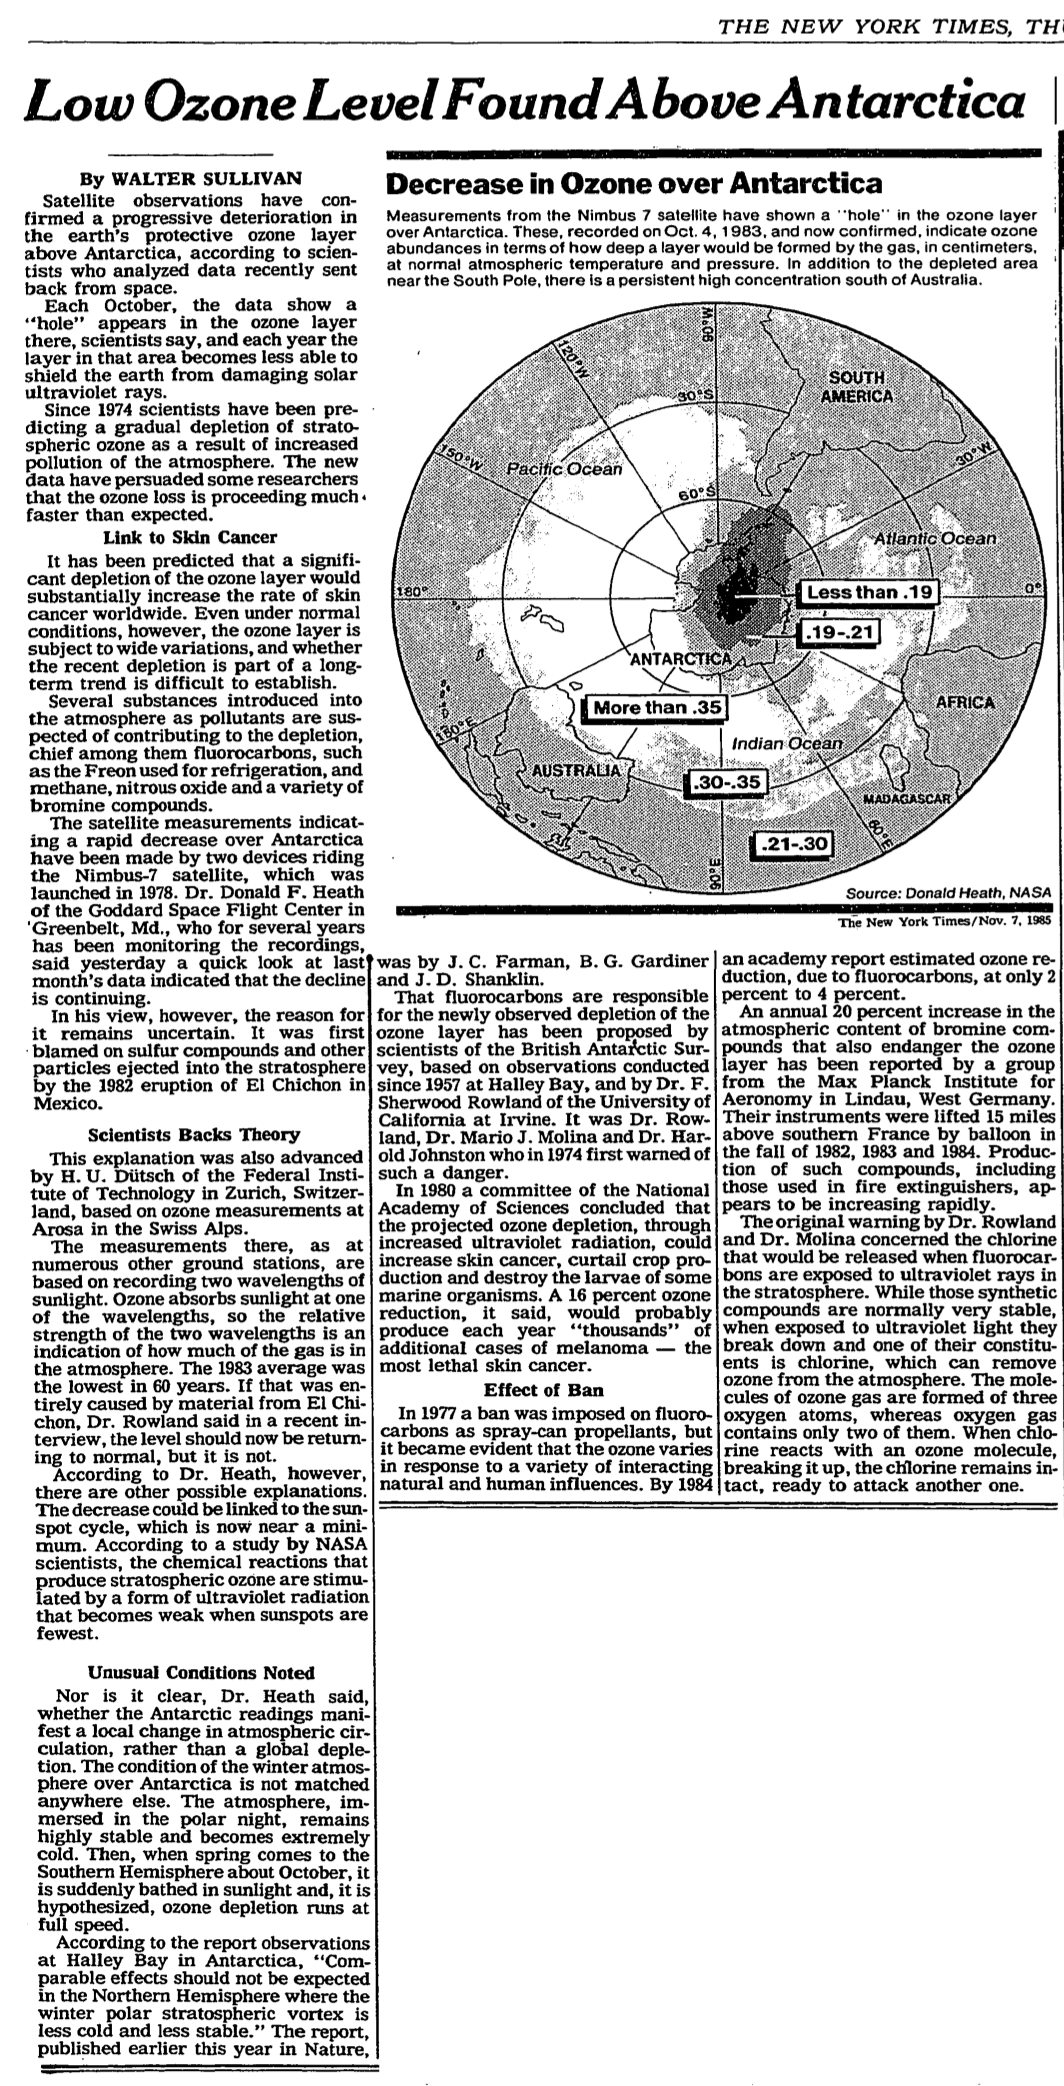
The article is also notable for reflecting the uncertainty that existed at the time about the cause of the anomaly. Farman et al had suggested strongly that increased chlorine loads in the stratosphere were causing the depletion, but two alternate theories were still credible – a dynamical theory based on anomalous upwelling of (relatively depleted) tropospheric air and a solar-cycle related cause.
It wasn’t until August 1986 that the first ‘proper’ NASA publication on the NIMBUS trends was published (Stolarski et al., 1986). This data had been processed with additional low DU profiles as part of the calibration and showed clearly the long term trend down across the polar vortex:
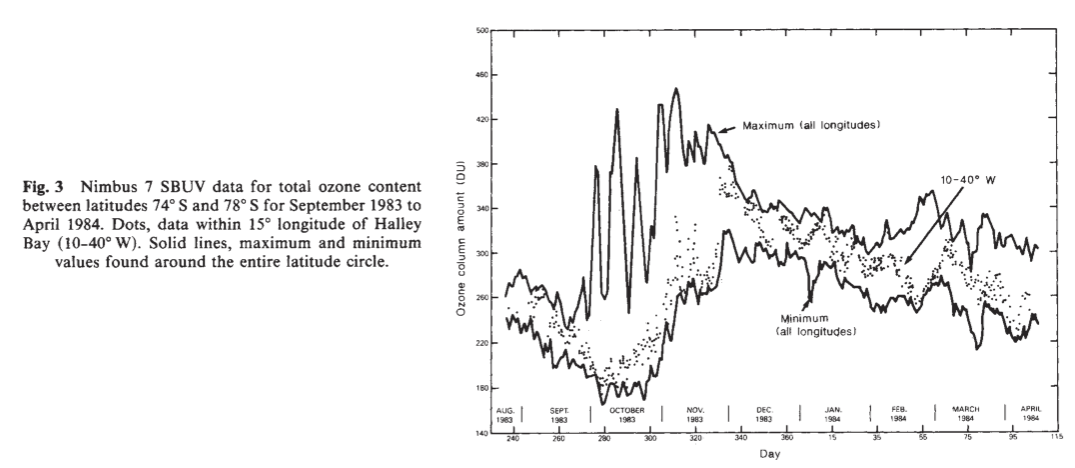
and specifically collaborated the low (sub 200 DU) Oct 1983 values seen at Halley Station (dots):
Also in 1986, the South Pole group reported that the preliminary observations from Oct-Dec 1983 had been invalid – the wrong channels had been read on the instrument – a problem that certainly slowed the NASA reporting.
Further field work by NASA during the 1987 Airborne Antarctic Ozone Experiment (AAOE) ended up providing definitive evidence in favor of the chlorine hypothesis, with details of the heterogeneous chemistry on polar stratospheric clouds as hypothesized by Susan Solomon and colleagues in 1986.
Summary
It seems to me that the extra details provided by McPeters and Bhartia (which have been available for many years, though perhaps have not been widely read), and the figure from 1984, change the nature of this story. It isn’t a simple tale of over-confidence in algorithms in the face of black swan events, but rather a tale of poor communications and siloed researchers that slowed down the ability of the wider community to see and interpret what was going on. In some sense this doesn’t matter – enough people were looking at ozone in the polar vortex that if Farman hadn’t reported this, NASA, the South Pole group or the Japanese would have seen it soon enough with similar impacts on the Montreal Protocol negotiations. But the barriers to rapid communication certainly slowed down the community response. For instance, it has been reported that the Farman group had attempted to contact people at NASA prior to publication, but their letters were not sent to the right folk and were never received.
What if this were to happen today?
Today, satellite-retrieved ozone data (like much NASA remote sensing) is available in real time. Dramatic increases in ‘bad’ data would be obvious to many right away. With email and (perhaps) a more open scientific culture, people looking at instruments on the ground would have been able to telegraph concerns to the right people working on satellites and other ground stations to confirm their observations much earlier. It seems likely that the initial publications would have been joint efforts (or at least coordinated), even if attribution of the change would still have been contentious.
None of the above should be taken as trying to diminish the work of Farman and colleagues whose ‘old school’ brand of observational science certainly paid off, but a result is far more powerful when seen in multiple independent records.
Further reading/viewing
First-hand descriptions of the NASA effort are available as “MANIAC” (auto-biographical) talks from Paul Newman, P.K. Bhartia and Richard Stolarski at GSFC:
And some further reading here on the role of imagery and metaphor in the ozone “hole” discussion.
References
J.C. Farman, B.G. Gardiner, and J.D. Shanklin, “Large losses of total ozone in Antarctica reveal seasonal ClO
x
/NO
x
interaction”, Nature, vol. 315, pp. 207-210, 1985. http://dx.doi.org/10.1038/315207a0
R.S. Stolarski, A.J. Krueger, M.R. Schoeberl, R.D. McPeters, P.A. Newman, and J.C. Alpert, “Nimbus 7 satellite measurements of the springtime Antarctic ozone decrease”, Nature, vol. 322, pp. 808-811, 1986. http://dx.doi.org/10.1038/322808a0
P.K. Bhartia, “Role of Satellite Measurements in the Discovery of Stratospheric Ozone Depletion”, Twenty Years of Ozone Decline, pp. 183-189, 2009. http://dx.doi.org/10.1007/978-90-481-2469-5_13
W.D. Komhyr, R.D. Grass, and R.K. Leonard, “Total ozone decrease at South Pole, Antarctica, 1964-1985”, Geophysical Research Letters, vol. 13, pp. 1248-1251, 1986. http://dx.doi.org/10.1029/GL013i012p01248
S. Solomon, R.R. Garcia, F.S. Rowland, and D.J. Wuebbles, “On the depletion of Antarctic ozone”, Nature, vol. 321, pp. 755-758, 1986. http://dx.doi.org/10.1038/321755a0