Guest Commentary by Scott Denning
The Orbiting Carbon Observatory (OCO-2) was launched in 2014 to make fine-scale measurements of the total column concentration of CO2 in the atmosphere. As luck would have it, the initial couple of years of data from OCO-2 documented a period with the fastest rate of CO2 increase ever measured, more than 3 ppm per year (Jacobson et al, 2016;Wang et al, 2017) during a huge El Niño event that also saw global temperatures spike to record levels.
As part of a series of OCO-2 papers being published this week, a new Science paper by Junjie Liu and colleagues used NASA’s comprehensive Carbon Monitoring System to analyze millions of measurements from OCO-2 and other satellites to map the impact of the 2015-16 El Niño on sources and sinks of CO2, providing insight into the mechanisms controlling carbon-climate feedback.
Uncertainty in Carbon-Climate Feedbacks is important
We’ve known for decades (Rayner et al, 1999) that El Niño influences the productivity of tropical forests and therefore CO2, but we had very few direct observations of the effects because they are so remote. Field experiments on the ground and aircraft profiling of CO2 over tropical forests have documented the impact of heat and drought on forest productivity, but they are few and far between. Vigorous convective mixing in the deep tropics also dilutes changes in near-surface CO2 much more than at higher latitudes, so low-altitude sampling contains relatively less information about carbon sources and sinks.
A subset of Earth System Models (ESMs) project that El Niño-like conditions will progressively increase in coming decades as sea-surface temperatures in the tropical Pacific warm, implying increased drought and forest dieback in the Amazon. The drought-induced decline of carbon-dense tropical forests and their replacement by lower-carbon savannas would release enormous amounts of CO2 to the atmosphere, amplifying global warming far beyond the effects of just the CO2 released by burning fossil fuels. In the CMIP5 suite of ESMs summarized by the IPCC Fifth Assessment Report, models forced with identical fossil fuel emissions differed by as much as 350 ppm of CO2 in 2100 due to differences in feedback between climate and the carbon cycle (Hoffmann et al, 2014). The radiative forcing of climate in these ESMs differed by up to 1.5 W/m2, with much of the disparity being driven by interactions among warming oceans, atmospheric circulation, and tropical forests. The climate outcomes due to differences carbon-climate feedback are as different as those arising from different future emission scenarios (RCP6 compared to RCP4.5) or from differences in clouds and aerosols in atmospheric models.
The NASA Carbon Monitoring System
NASA’s Carbon Monitoring System (CMS) combines mechanistic “forward” models and empirical “inverse” models of atmospheric CO2 and other variables using a technique called “data assimilation” that is closely analogous to operational weather forecasting (Bowman et al, 2017). The forward models include emissions of CO2 and carbon monoxide (CO) from fossil fuel burning and wildfires; air-sea gas exchange; and photosynthesis, respiration, and decomposition on land. These simulated emissions are then used as input to a model (GEOS-Chem) that uses high-resolution weather data atmospheric transport of CO2 and CO by winds, clouds, and turbulence. The resulting 3D simulations are then sampled at the locations of OCO-2 observations to determine the error in the forward model of atmospheric variations. An “adjoint” of the atmospheric transport model is then run backward in time to quantify the contributions of errors in specified surface sources and sinks of CO2 and CO to the mismatches between the forward models and the satellite observations.
OCO-2 has given us two revolutionary new ways to understand the effects of drought and heat on tropical forests. The instrument directly measures CO2 over these regions thousands of times every day (Crisp et al, 2004). These column-averaged concentration retrievals respond to the net amount of CO2 passing in and out of the atmosphere under the instrument. OCO-2 also senses the rate of photosynthesis by detecting fluorescent chlorophyll in the trees themselves (Frankenberg et al, 2011). Liu et al used observations of CO from the MOPITT instrument aboard NASA’s Terra satellite to identify CO2 released from upwind wildfires. They used solar-induced chlorophyll fluorescence (SIF) to quantify changes in plant photosynthesis (also called gross primary production, GPP). Their results include time-resolved maps of the sources and sinks of atmospheric CO2 that are optimally consistent with both mechanistic forward models and the CO2, CO, and SIF observed by the satellite instruments.
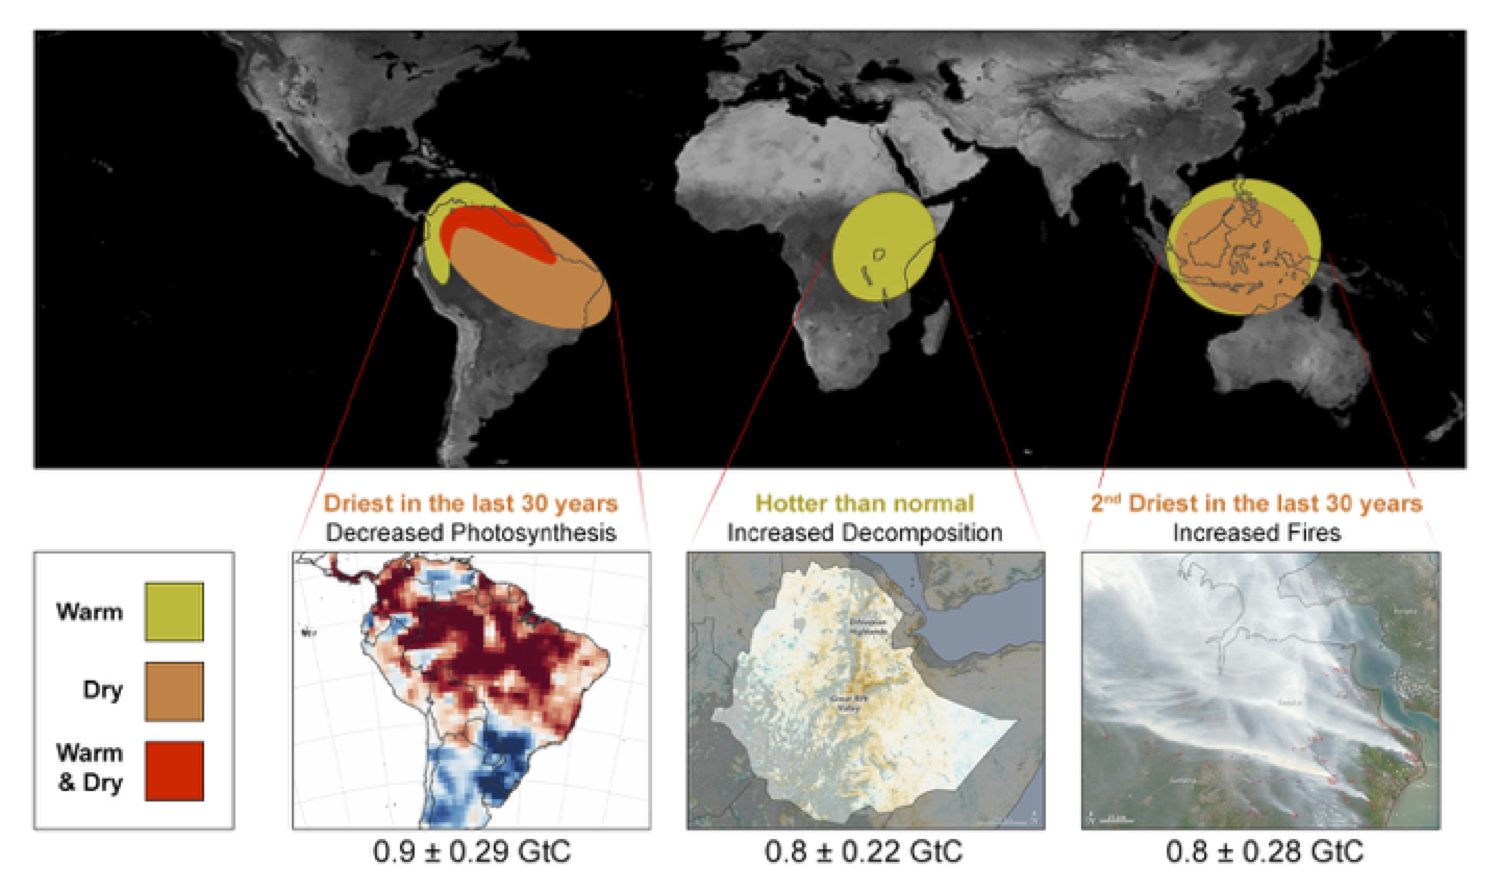
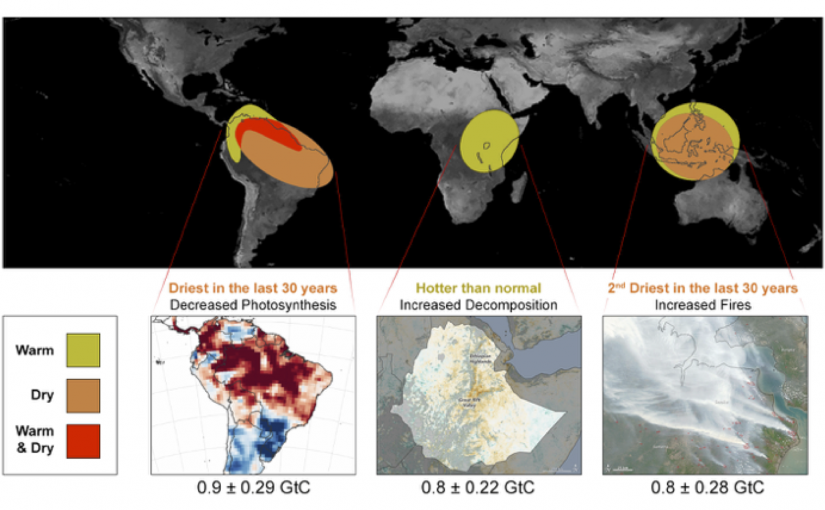
Fig. Extreme heat and drought impacted the carbon cycle in tropical forests differently in different regions, leading to the fastest growth rate of CO2 in at least 10,000 years. (NASA/JPL-Caltech).
Carbon-Climate Feedback During the 2015-16 El Niño
As previously reported based on in-situ data, the rate of increase in atmospheric CO2 during the strong El Niño in 2015-16 was about 3 ppm/yr compared with ~2 ppm/yr in recent decades. This is the fastest increase in CO2 ever observed, and plausibly the fastest since the end of deglaciation 10,000 years ago. Yet this rapid increase in CO2 occurred during a period when fossil fuel emissions were nearly flat (though still massively more than the biosphere and ocean can quickly absorb).
Liu et al found that 80% of the extra CO2 in the atmosphere during this period originated in tropical forests. Relative to a more normal year (2011), they found that tropical forests lost about 2.5 billion tons of carbon (GtC) in 2015-16. (1 Gt = 1012 kg is the mass of 1 cubic km of water, and 1 GtC produces about 2.12 ppm of CO2 in the air).
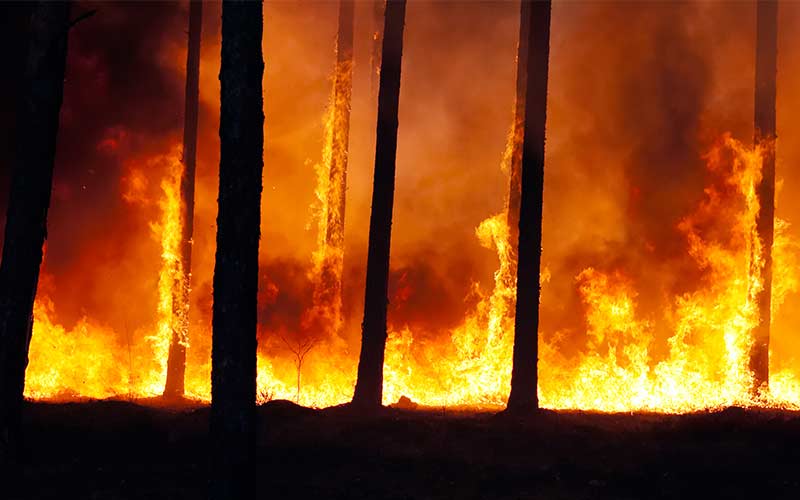
During the huge El Niño, parts of the Amazon experienced the driest conditions in at least 30 years as well as unusually warm temperatures. Changes in column-averaged CO2 and in SIF showed that these hot, dry conditions suppressed gross primary production (GPP, photosynthesis), leading to a reduction of about 0.9 GtC/yr. Equatorial Africa also experienced extreme heat, but precipitation was near normal. Impacts on GPP were not significant, but respiration and decomposition were enhanced by about 0.8 GtC/yr. In Hot dry conditions in Indonesia during the period led to an increase in fires, including a large peat fire that burned huge amounts of stored carbon. Emissions due to these fires showed up in the observations as increases in both CO2 and CO, and were estimated at about 0.8 GtC/yr.
These results help us understand how drought and heat affect these forests, some of the most productive ecosystems on Earth. The Amazon has experienced three extreme droughts in the past 11 years, in 2005, 2010, and now 2015-16. These extreme events have occurred more frequently than they did in the previous century. Understanding how the tropical forest responds to big droughts and heat waves help us to evaluate the strength of carbon-climate feedback in ESMs, allowing us to better understand and predict climate change over coming decades. The new results show that each of the major tropical forest regions experienced different combinations of heat and drought during the recent El Niño, so their carbon cycles responded in different ways, but the net result was increased emissions in all cases. Based on these results, further warming and drying of tropical forests is expected to result in less uptake and more release of carbon on land, unfortunately amplifying the effect of fossil fuel emissions warming the climate.
References
J. Wang, N. Zeng, M. Wang, F. Jiang, H. Wang, and Z. Jiang, “Contrasting terrestrial carbon cycle responses to the two strongest El Niño events: 1997–98 and 2015–16 El Niños”, Earth System Dynamics Discussions, pp. 1-32, 2017. http://dx.doi.org/10.5194/esd-2017-46
J. Liu, K.W. Bowman, D.S. Schimel, N.C. Parazoo, Z. Jiang, M. Lee, A.A. Bloom, D. Wunch, C. Frankenberg, Y. Sun, C.W. O’Dell, K.R. Gurney, D. Menemenlis, M. Gierach, D. Crisp, and A. Eldering, “Contrasting carbon cycle responses of the tropical continents to the 2015–2016 El Niño”, Science, vol. 358, pp. eaam5690, 2017. http://dx.doi.org/10.1126/science.aam5690
P.J. Rayner, R.M. Law, and R. Dargaville, “The relationship between tropical CO2fluxes and the El Niño-Southern Oscillation”, Geophysical Research Letters, vol. 26, pp. 493-496, 1999. http://dx.doi.org/10.1029/1999GL900008
“Climate Change 2013 – The Physical Science Basis”, 2009. http://dx.doi.org/10.1017/CBO9781107415324
K.W. Bowman, J. Liu, A.A. Bloom, N.C. Parazoo, M. Lee, Z. Jiang, D. Menemenlis, M.M. Gierach, G.J. Collatz, K.R. Gurney, and D. Wunch, “Global and Brazilian carbon response to El Niño Modoki 2011-2010”, Earth and Space Science, 2017. http://dx.doi.org/10.1002/2016EA000204
D. Crisp, R. Atlas, F. Breon, L. Brown, J. Burrows, P. Ciais, B. Connor, S. Doney, I. Fung, D. Jacob, C. Miller, D. O’Brien, S. Pawson, J. Randerson, P. Rayner, R. Salawitch, S. Sander, B. Sen, G. Stephens, P. Tans, G. Toon, P. Wennberg, S. Wofsy, Y. Yung, Z. Kuang, B. Chudasama, G. Sprague, B. Weiss, R. Pollock, D. Kenyon, and S. Schroll, “The Orbiting Carbon Observatory (OCO) mission”, Advances in Space Research, vol. 34, pp. 700-709, 2004. http://dx.doi.org/10.1016/j.asr.2003.08.062
C. Frankenberg, C. O’Dell, J. Berry, L. Guanter, J. Joiner, P. Köhler, R. Pollock, and T.E. Taylor, “Prospects for chlorophyll fluorescence remote sensing from the Orbiting Carbon Observatory-2”, Remote Sensing of Environment, vol. 147, pp. 1-12, 2014. http://dx.doi.org/10.1016/j.rse.2014.02.007