Joanna Walters links extreme weather events with climate change in a recent article in the Guardian, however, some reservations have been expressed about such links in past discussions.
For example, we discussed the connection between single storms and global warming in the post Hurricanes and Global Warming – Is there a connection?, the World Meteorological Organization (WMO) has issued a statement, and Mike has recently explained the connection in the Guardian.
We still cannot say that single events are caused by climate change for the simple reason that climate change is not a force.
Rather, climate change is a consequence of changed physical conditions. Indeed, one type of climate change could hypothetically consist of storms just becoming more powerful.
I will explain what I mean with climate change below.
Added insight through statistics
If you want to understand the world, then statistics can provide some insights if you have a large number of observations or measurements. This is especially so if you live in a very complex universe with a lot of complicated factors and it is difficult to solve all the equations representing the physics.
To distill information about the climate, you can sort weather data according to different categories, such as magnitude. Then create a table keeping a count of the number of cases that fall into each category, and you will be able to see what magnitudes are common and what range within which you expect them to fall.
You can also plot this type of statistics as a figure known as a histogram.
The histogram is a crude way of showing how frequently you can expect the measurement to fall into each category.
The frequency is proportional to the probability, and you can fit a smooth probability density function (pdf) to the data.
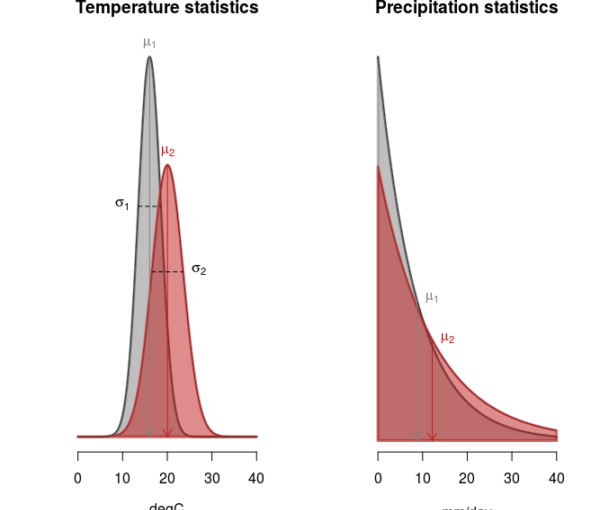
Typical examples of pdfs include the bell-shaped normal distribution for temperature (left panel in the Fig. 1) and the exponential distribution for 24-hr precipitation (right panel i Fig. 1).
What I mean by climate
I usually say that climate is the same as weather statistics (or more precisely, the statistical characteristics of meteorological variables), providing information about what type of weather to expect and its probability.
This statistics, however, will not tell you what one particular outcome will be (i.e. a weather forecast) nor is it a force that influences the outcomes.
The statistics is a mere reflection of (hidden) underlying forces of physics.
Global warming is one kind of climate change caused by an increased greenhouse effect with an impact on both meteorology and the hydrological cycle. It involves physical conditions which set the stage for evaporation, convection, condensation of water vapour, formation of clouds, and precipitation.
Statistical parameters are surprisingly predictable, and weather statistics is systematically influenced by the physical conditions present.
This dependency to physical conditions is evident from how the temperature and precipitation vary from place to place: typically warmer at low latitudes and cooler at higher altitudes; more rain near the coast and less in the interior.
There is also more intense rainfall in the warm tropics than the cooler extra-tropics, and summer precipitation is often more intense than in winter due to different physical conditions.
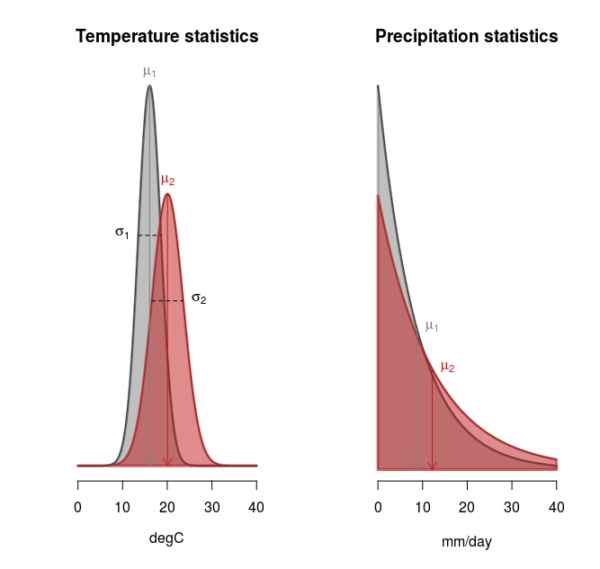
Typical probability density functions (pdfs) of temperature (left) and precipitation on rainy days (right).
What I mean by climate change
One definition of a climate change is a shift in the pdf describing the temperature, precipitation, or some other variable.
Such a shift in the pdfs is illustrated in Fig. 1 where the grey shading represents the original climate and the red shading a changed climate.
Some variables are strongly affected by changes physical conditions, others are less so. One indicator for their sensitivity to a climate change can be how their character depends on the season, geography, natural variations, or if they exhibit pronounced long-term trends.
Different kinds of extremes
Extremes are often defined as the tails of the distribution (upper or lower parts of the curves in Fig. 1), which are associated with low probability but magnitudes near observed ranges. The magnitude can be either very high (e.g. heat waves, heavy precipitation, intense wind speeds) or low if the pdf has two tails (e.g. freezing temperatures).
The expression “weather extremes” is a catch-all phrase, and not very useful for describing the actual situations. There is a range of different types of extreme weather events, with different nature and different manifestations.
For instance, there are conditions which are present all the time, such as temperature or barometric pressure (there are no days without temperature or pressure). These can be described by one single pdf to indicate their magnitude at any time.
Some conditions are intermittent, such as rain (it doesn’t rain constantly all the time). There are two aspects characterizing intermittent phenomena: how often do these phenomena take place and how intense are they.
For intermittent phenomena, you need two pdfs: one describing their presence (e.g. a Poisson distribution) and one indicating the magnitude when their are present (e.g. Fig. 1).
Some meteorological phenomena are both rare and violent, such as tropical cyclones, mid-latitude cyclones, tornadoes, hail, and lightning.
The more frequent they are, the greater the chance for seeing very extreme events just because you get a larger sample of events over time.
We can use these ideas as a context for Joanna Walters’s article and Hurricane Harvey.
Tropical cyclones
One thing is that global warming may have boosted its force, but will a global warming result in more frequent tropical cyclones?
The oceans are warming, and these hurricanes represent one mechanism that moves the heat from the surface to high levels in the atmosphere where it can escape to space.
We know that the number of tropical cyclones is influenced by several factors: the seasonal cycle, the geography, ocean temperatures and the wind structure in the atmosphere.
According to the IPCC AR5, however, there are little indications of a change in the number of tropical cyclones, although they are becoming more intense (p. 107, TS.5.8.4 Cyclones):
that it is likely that the global frequency of tropical cyclones will either decrease or remain essentially unchanged, concurrent with a likely increase in both global mean tropical cyclone maximum wind speed and rain rates
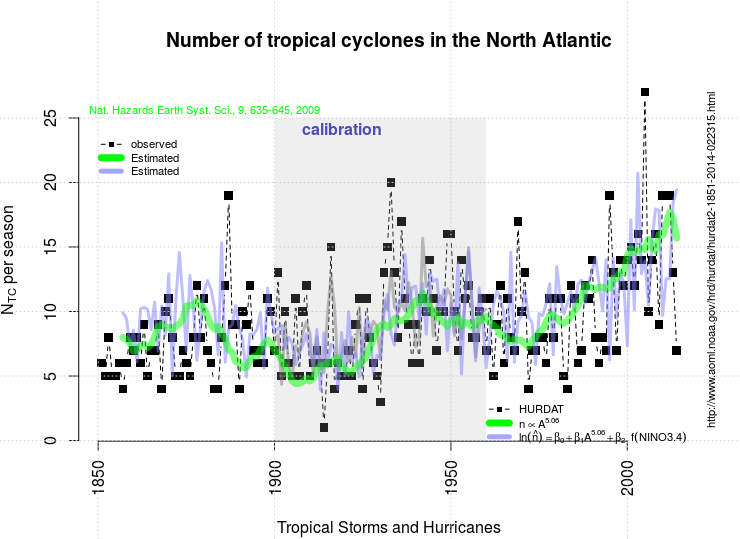
I believe the jury is still out on the question of the number of tropical cyclones because the IPCC’s assessment has so far not included studies on the relationship between the number of tropical cyclones and the area of high sea surface temperature, such as the analysis shown in Fig 2 (1).
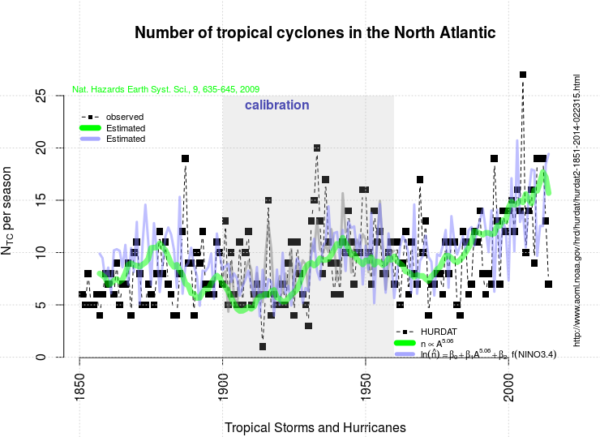
Fig. 2 shows predictions with a simple model that predicts the number of tropical cyclones (NTC and n) in the North Atlantic based on the area of warm sea surface (A) and the NINO3.4 index. It was created in R using the script tropicalcyclones.R which also retrieves the data. The model was calibrated over the period 1900-1960, and the predictions provide reasonable similar evolution of the North-Atlantic tropical cyclones outside this period. (PDF-version).
The analysis in Fig. 2 shows a crude prediction of the number of tropical cyclones (n) in the North Atlantic based on the area of warm ocean surface (A), and we see a roughly similar trend in these predictions as in the HURDAT2 tropical cyclone record.
One caveat with such empirical studies, however, is that the data record is incomplete and there is a risk that the analysis presents a false picture.
Nevertheless, the IPCC AR5 presents an outlook of increasing extreme precipitation in tropical cyclones making landfall (p. 106, Table TS.2), which is relevant for the flooding connected to Harvey.
Flooding may also become more severe from changes in the landscape, as explained by John Vidal in an article in the Guardian.
I think Joanna Walters’ article about extremes and climate change describes the current situation well, and we should not be too surprised.
A change in the pdf reflects a climate change, and in most cases its range and tails tend to follow the part of the curve that represents the more common conditions.
We must assume that it is only the exceptional cases where the tails of the pdf are unaffected. Furthermore, an increase in the number of tropical cyclones would increase the number of more cases with extreme rainfall.
References
R.E. Benestad, “On tropical cyclone frequency and the warm pool area”, Natural Hazards and Earth System Science, vol. 9, pp. 635-645, 2009. http://dx.doi.org/10.5194/nhess-9-635-2009

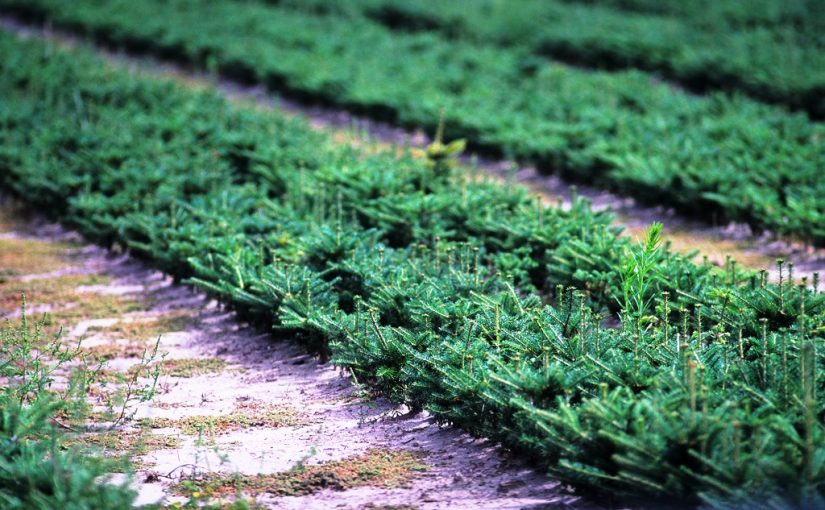
 How Forest Forensics Could Prevent the Theft of Ancient Trees — Smithsonian Magazine


 I’ve always been fascinated by vines. Ever since I was little, I would help my mother in her garden, and I would always make a beeline for the peas, just to check on their progress. It was just so interesting to watch them stretch and grasp as the weeks went by, meandering up trellises and over branches. It was my first exposure to nature as something capable of change.