Healing Plants You Can Forage

July 20th, 2017|0 Comments

.fusion-fullwidth-1 {
padding-left: px !important;
padding-right: px !important;
}

By Allie Wisniewski, American Forests

Some of the most common plants growing around you are frequently dismissed as weeds, but many of them actually have medicinal uses you might find helpful! Read below to discover the hidden uses of these intriguing and underlooked parts of our ecosystem.

Dandelion

Credit: Maky Orel

Chances are that you spent at least a small portion of your childhood making wishes with these iconic dandelion tufts. But did you know that they’re edible, and, even better, a superfood? There’s a reason I spotted dandelion greens at a salad bar not too long ago. While that should certainly add to their credibility, it’s rather unnecessary to spend $8.99 a pound for what most of the population considers a weed, especially when nature offers an essentially unlimited supply at no cost at all. Every part of the dandelion plant is edible, and offers an incredible variety of health benefits when consumed. Dandelion juice is known as a detoxifier, diuretic and antioxidant, and helps reduce cancer-causing free radicals in the body. Dandelion also helps to promote liver health and digestion, remedy anemia and reduce blood pressure.

Stinging Nettle

Credit: Blick Pixel

While its name might allude to something you might generally avoid ingesting, stinging nettle is rich in vitamins and has been used for centuries to treat eczema, arthritis, gout and anemia. The leaves, stems and roots are all edible, though younger leaves are usually preferable in terms of taste, texture and nutrition. Remember not to eat them raw, however — the plant is called stinging nettle for a reason. For best results, add leaves to soups and stews (they make a great spinach substitute), or dry them and infuse with hot water to make tea.

Chickweed

Credit: Hans Braxmeier

Chickweed is both hardy and delicate. One of the most common weeds found in suburban lawns around the country, it can also be found in deciduous forests, fields and pastures. Its flowers resemble tiny white stars, and while they are edible when cooked, the leaves contain a much higher concentration of nutrients. Unlike stinging nettle, chickweed greens can be enjoyed raw and are used to treat asthma and other lung diseases, obesity, vitamin C deficiency (scurvy), psoriasis and even rabies. It can also be applied topically to heal boils, rashes and ulcers.

Broadleaf Plantain

Credit: F.D. Richards

I grew up seeing this plant cover every inch of my favorite parks and greenspaces, but of course knew nothing of its medicinal powers at the time. It’s no wonder that I saw it everywhere — turns out these plantains are invasive. That being the case, I generally advise against planting this species in your own garden, and instead recommend venturing into a field or local park where they’re likely already sprawling in abundance. Make sure, however, that the area isn’t chemically treated. Plantain leaves are most commonly harvested for medicinal use, known to have antimicrobial, astringent and anti-inflammatory properties. They’re particularly rich in calcium and vitamin K, and are used topically to treat burns, cuts, sunburn, sores and boils. Internally, plantain helps improve liver and kidney function and can help to ease throat infections and common cold symptoms.

Wood Sorrel

Credit: Andre Karwath

I remember a friend of mine once offering me a clover-shaped leaf, assuring me it was fine to eat and even tasted good — subtly tart like the skin of a green apple. Although I was hesitant, I tried it, and she was surprisingly right. Wood sorrel is a frequent visitor to my own backyard, and many others around the country. Its leaves, flowers and bulbs are all edible and medicinal. Considered a diuretic, it has a multitude of healing properties, used to relieve hemorrhages, cleanse blood, produce an appetite, and remedy ulcers in the mouth. Its juice is also known to reduce swelling and inflammation. What’s not to love? Add wood sorrel to your next salad for a healthy kick.

The post Healing Plants You Can Forage appeared first on American Forests.

The climate has always changed. What do you conclude?

Probably everyone has heard this argument, presented as objection against the findings of climate scientists on global warming: “The climate has always changed!” And it is true: climate has changed even before humans began to burn fossil fuels. So what can we conclude from that?

A quick quiz

Do you conclude…

(1) that humans cannot change the climate?

(2) that we do not know whether humans are to blame for global warming?

(3) that global warming will not have any severe consequences?

(4) that we cannot stop global warming?

The answer

Not one of these answers is correct. None of these conclusions would be logical. Why not?

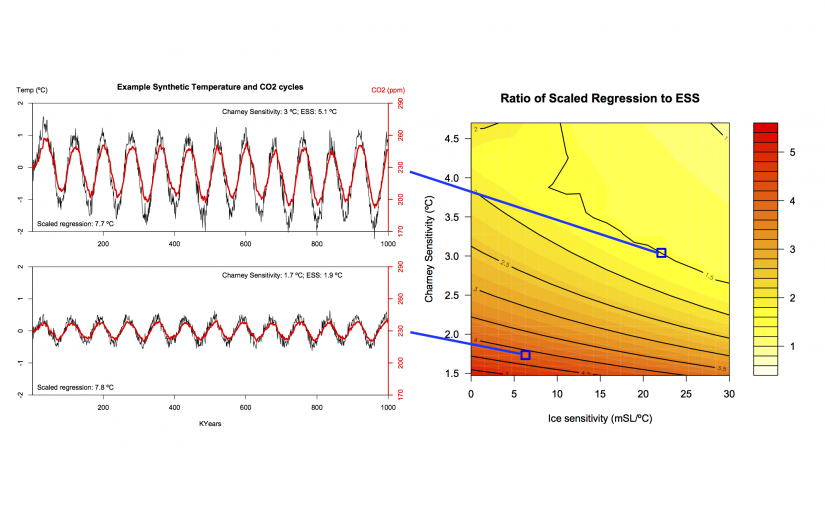
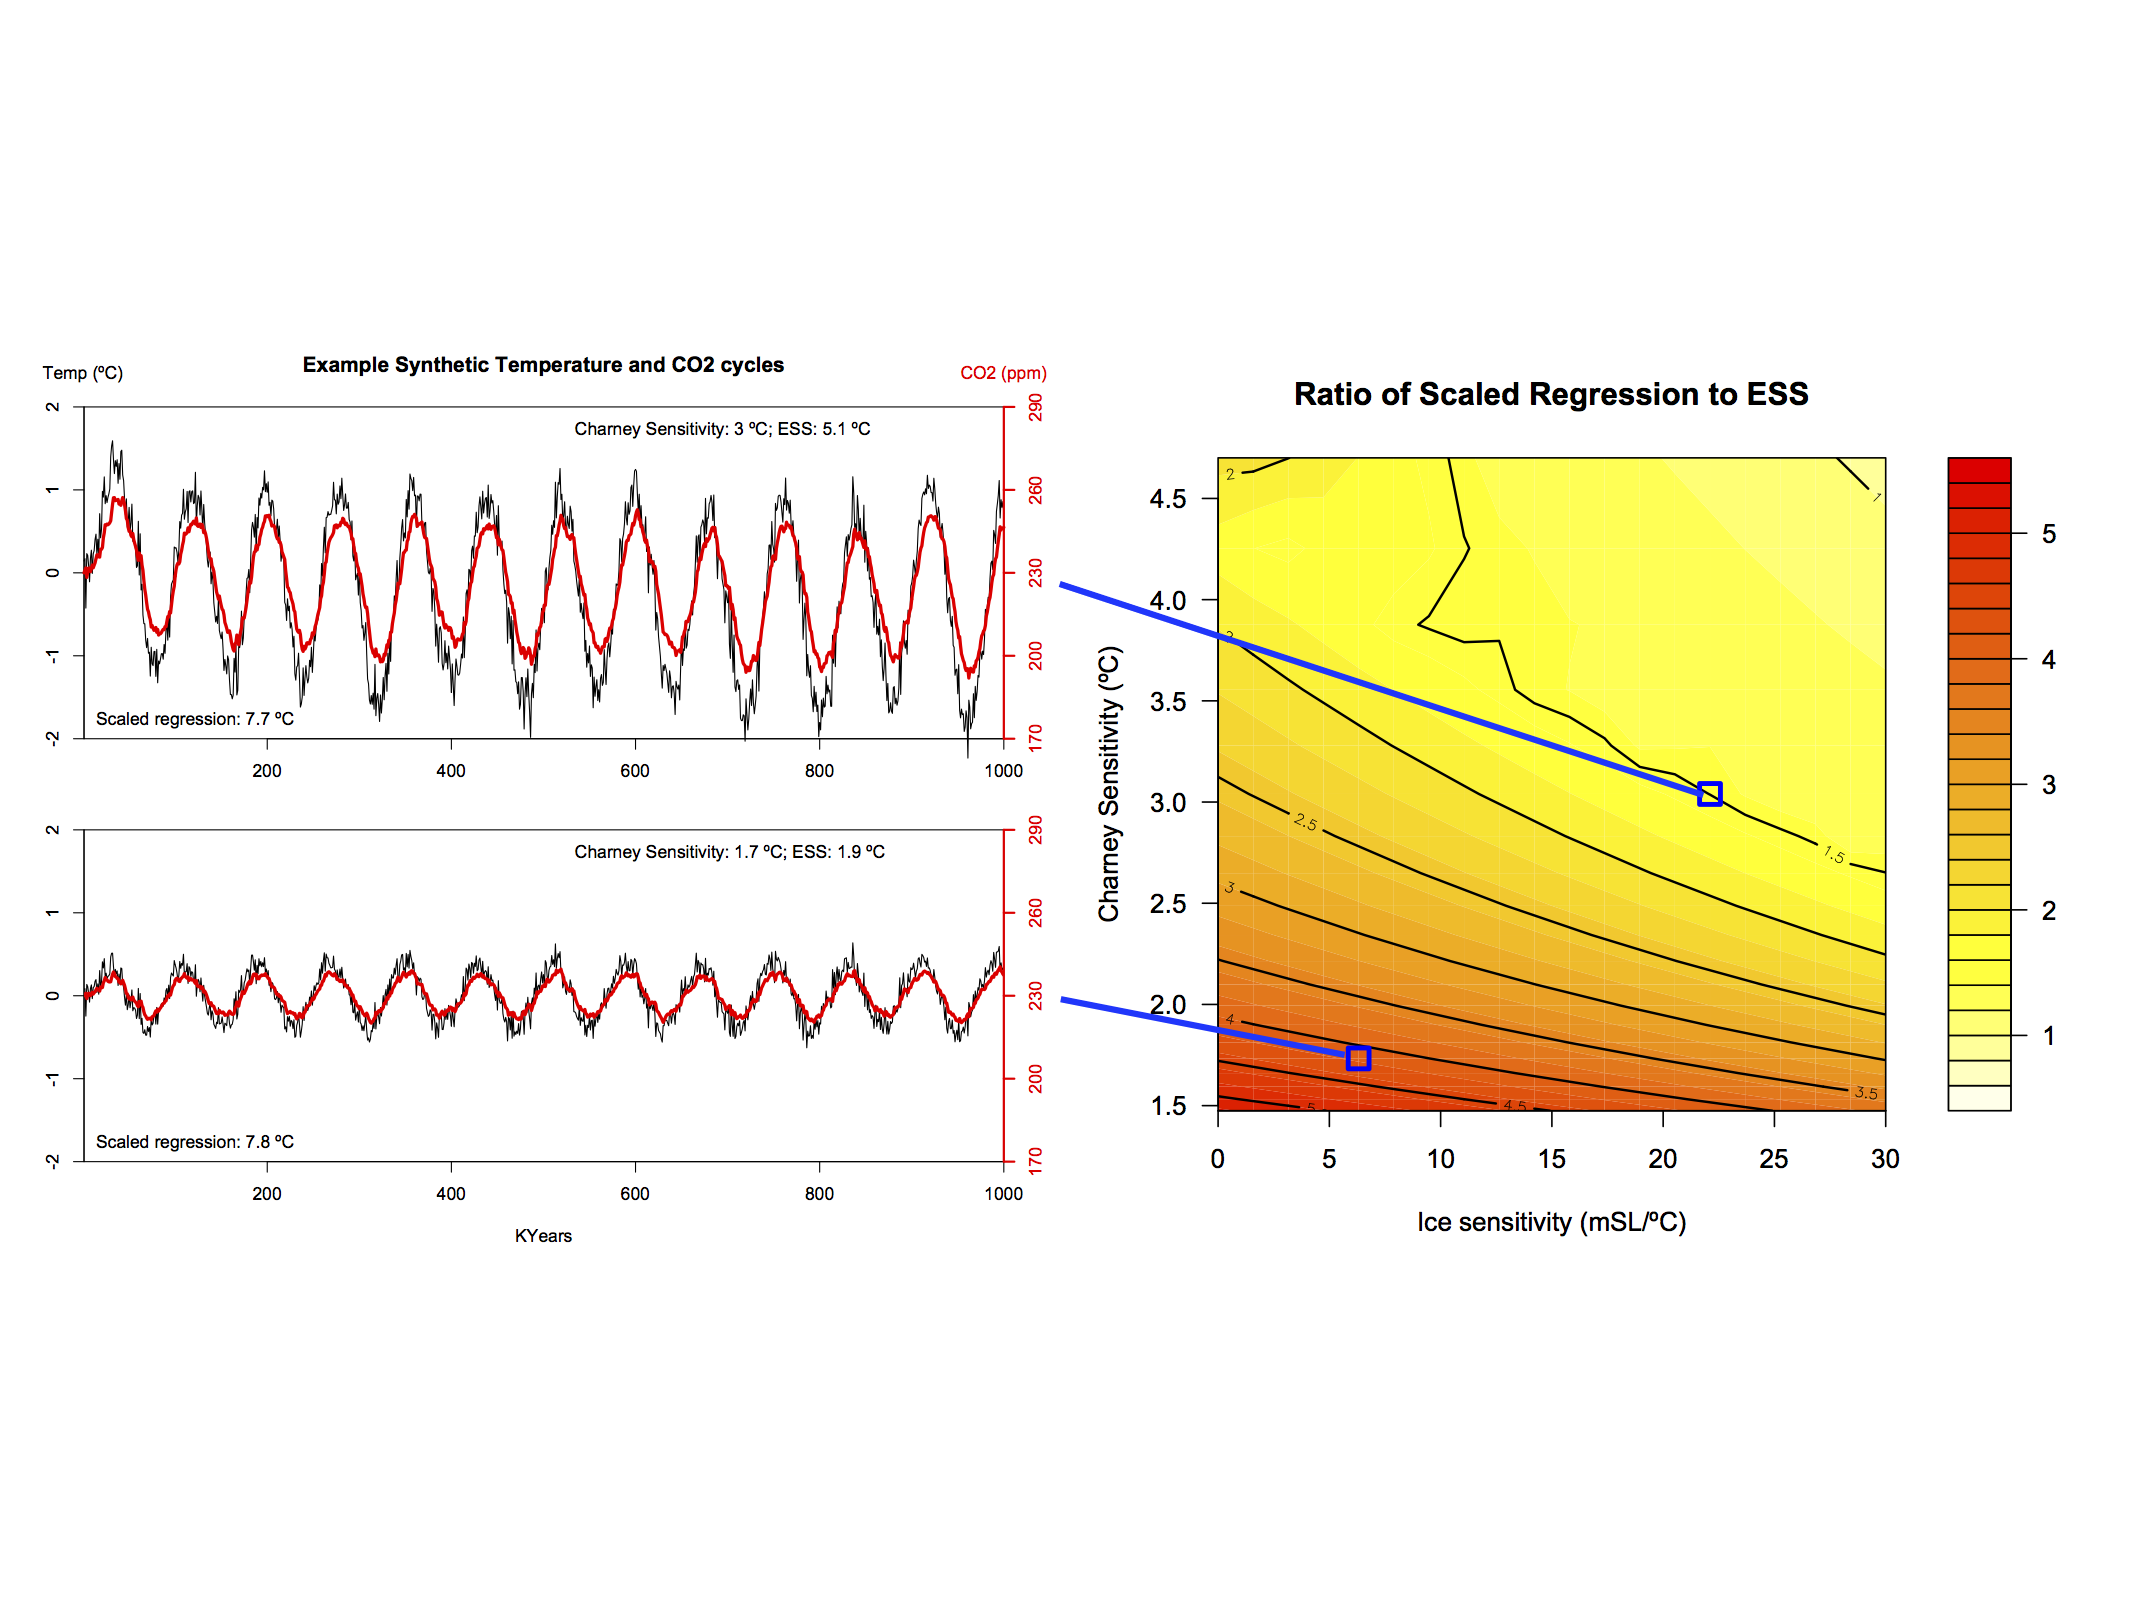
(1) The opposite conclusion is correct: if the climate had hardly changed during the course of the Earth’s history (despite variable incoming solar radiation and changing amounts of CO2 in the atmosphere), then we would conclude that there are strong stabilizing feedbacks in the climate system. The drastic climate changes in the history of the Earth (ice ages, hot ice-free periods) show that the climate system is sensitive to changes in the radiation budget. The measure for this sensitivity is called climate sensitivity: how much global warming will result from a CO2 doubling in the air? For the first time it was estimated by the Nobel laureate Svante Arrhenius in 1896. According to our modern knowledge this climate sensitivity is around 3°C (uncertainty ± 1°C).

Paleoclimatologists determine the climate sensitivity from data from the Earth’s history. A recent review article in Nature on this method showed “a warming around 2.2 to 4.8 °C per doubling of atmospheric CO2, which agrees with IPCC estimates”. In short: the larger past natural climate changes have been, the more vulnerable is the climate system, and the more it will react to the greenhouse gases that humans are adding to the system.

(2) Imagine there has been a forest fire. The police have extensive evidence that it was arson. They know the place where the fire began. They found traces of fire accelerants. Witnesses observed a man whose car was parked nearby. In his trunk the police finds bottles with fire accelerants, and in his house they find even more of it. He has been convicted for arson several times before. Plus some further evidence. In court, he defends himself: forest fires have always occurred lit by lightning, even before there was any man on Earth. Therefore he must be innocent. Does the argument convince you?

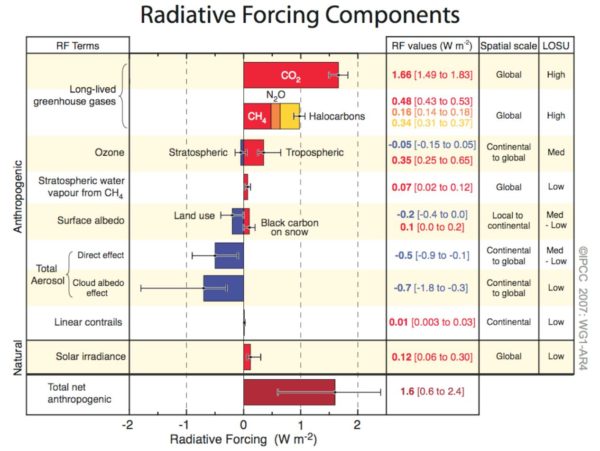
The evidence for the human cause of global warming is overwhelming. This is why there has been a consensus among climate researchers for a long time, and almost every scientific academy on the planet has come to the same conclusion. The most important evidence: when it gets warmer, the energy has to come from somewhere (1st law of thermodynamics). It can only come through the radiation budget of our planet. (No, Rick Perry, the energy does not come out of the ocean. To the contrary, measurements show heat is going into the oceans). The changes in this energy balance are quite well known and are shown near the front of any IPCC report – see Fig. 1. The biggest factor is the increase in CO2 concentration as well as a few other greenhouse gases, also added by human activities. The incoming solar radiation has changed just a tiny bit in comparison – since 1950, by the way, it has even decreased and thus offset a small part of the human-caused warming – hence humans have probably caused more warming than is observed (best estimate is 110% of observed warming).

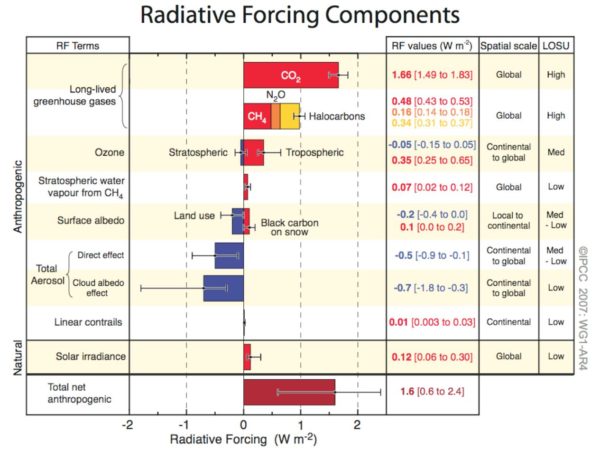
Fig. 1 Radiative forcing is the cause of global temperature changes. Red bars show warming, blue bars cooling effects. I am showing the diagram from the fourth IPCC report of 2007, because it is easier to understand than the more recent from the 5th IPCC Report of 2013, which Gavin discussed here. The overall human-caused radiative forcing, which is given here as 1.6 watts per square meter, had already risen to 2.3 watts per square meter by the year 2011 according to the 5th IPCC report. Source: IPCC report 4 Fig. SPM.2.

Overall, humans have caused an additional heating (radiative forcing) of 2.3 watts per square meter of Earth surface – as of 2011. It has increased further since.

(3) Those who can’t deny that humans are causing warming often seek refuge in the hope that the consequences might not be so bad, so we might just adapt rather than having to stop further warming. The climatic changes in Earth’s history do not support this point of view. As a result of the global warming by around 5 ° C from the last ice age 15,000 years ago to the mid-Holocene, global sea levels rose by 120 meters until 5,000 years ago! At that time hardly a problem – but for today’s humankind even a rise of two meters would be a disaster, bringing devastation to coastal cities and small island states. We still have enough ice on Greenland and Antarctica to raise the sea level around the world by 65 meters. Both ice masses are losing ice more and more quickly. The West Antarctic has probably already crossed its tipping point and is unstable. Greenland could soon follow.

Fig. 2 Ice loss of Greenland measured by GRACE satellites. Source: NASA .

By the way: the just mentioned 5°C rise within ten thousand years at the end of the ice age are among the fastest global temperature rises documented in the Earth’s history. That is 0.05 degrees per century. In the last hundred years we have caused the twentyfold rise. This pace of change overtaxes the adaptability of many ecosystems and will lead to their collapse as the warming progresses. In coral reefs this is already in progress.

The pace of the completely man-made CO2 increase (by now the CO2 concentration is higher than at any time in the past three million years) leads to a rapid acidification of the world’s oceans, because it overcomes the buffer capacity of the oceans. The last major acidification event 250 million years ago has apparently led to a massive extinction of species in the world’s oceans.

(4) Often I hear that the aims of the Paris Climate Agreement are absurd, because humans cannot stabilize the global temperature – after all, our climate changes even without human intervention. This argument is also wrong. As already mentioned, without human interference there would have been no global warming since the middle of the 20th century. If anything there would have been a slight natural cooling. The fluctuations in the sun’s activity are causing variations of 0.1 or 0.2 °C in global temperature in the last thousand years (e.g. at the Maunder Minimum of solar activity in the years 1645 to 1715). In the longer term, the astronomical Milankovitch cycles of the Earth’s orbit and the Earth’s axis dominate the natural climate changes (hence the ice ages). The shortest of these cycles has a period of 23,000 years – for the next hundred years, it practically does not matter. However, our fortune would last much longer than that: the Milankovitch cycles can be calculated over millions of years with astronomical precision (and incidentally be used to predict the beginning of all the past ice ages), and according to that, the next major climate change would arrive only in about 50,000 years. Namely the next ice age.

So if we weren’t doing something really stupid, we could benefit from another 50,000 years with a stable climate. Nothing in our knowledge of paleoclimatology suggests that natural factors could prevent us from limiting global warming to below 2°C. Only our own dithering, our own inertia can do that. Or that we prefer to be lulled into fatal complacency by the reassuring fairy tales of the “climate skeptics” rather than confronting the danger.

Among the most ill-informed claims of those “skeptics” is the assertion that climate researchers do not know or consciously ignore the fact that the climate has always changed. Utter nonsense, of course. Almost all of the authors here at Realclimate have done substantial work in paleoclimate for decades, as you can see from our publication lists (including the textbook Paleoclimatology). A lot of other climate researchers do the same. This May, three of us were at a conference of almost one thousand paleoclimatologists in Zaragoza (see photo below). These researchers know more about the natural, past climate changes than anyone else. Nobody there expressed any doubts about the ongoing human-caused global warming. On the contrary, many paleoclimatologists are particularly concerned about anthropogenic warming, especially in view of our findings about Earth’s history. Already when I was working as lead author on the paleoclimate chapter of the 4th IPCC report more than a decade ago, some of the discussions within IPCC revolved around us paleoclimatologists regarding some risks as considerably more serious than the colleagues specializing in the modern climate, such as the risk of rapid sea level rise or instability of ocean currents and ice sheets.

Whoever tells you that the fact that “the climate has always changed” is somehow reassuring, does not know what he is talking about – or he is trying to con you.

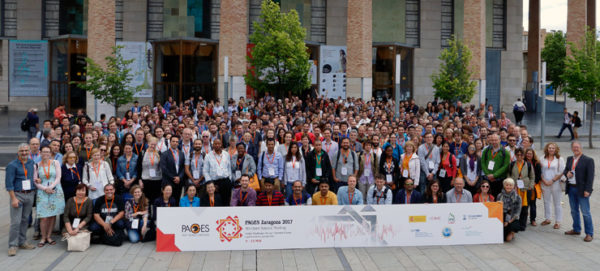
Paleoclimatologists: participants in the PAGES Open Science Meeting in Zaragoza in May 2017


More Than a Utility

July 19th, 2017|Tags: , , |0 Comments

.fusion-fullwidth-1 {
padding-left: px !important;
padding-right: px !important;
}

By Doyle Irvin, American Forests

This is one of an 11-part blog series detailing the extensive work we are doing with the Alcoa Foundation. You can find out more here.

Students learning to care for the environment in Massena.

The town of Massena in New York’s St. Lawrence County knows that winter is coming. Located right on the Canadian border, Massena is as far north as you can get in the state of New York, and sports one of the most active and invested public utilities in the United States.

The Massena Electric Department (MED) has been deeply involved in reforesting the town since an ice storm in 1998 made it abundantly clear that urban forests are a public asset — both impermanent and invaluable. The urban forest normally survives such harsh elements, but the adverse onset of the emerald ash borer has since stressed the tree canopies of upstate New York and rendered them especially susceptible to ice storms and other wintry antagonists.

The MED understands that trees benefit their own work, year round. They act as wind breaks during the winter and provide shade during the summer, which reduces the electricity demands of the town. What makes their efforts particularly interesting is that it’s not just a bottom-line decision for them — they are also interested in serving the community. The most significant factor of their work is that they are deeply invested in both assisting the underserved community, where tree canopy is normally the lowest, and educating youth about the importance of greenspace.

These aspects of their work are why American Forests and Alcoa Foundation are very proud to support their efforts. The holistic nature of the MED’s environmental goals makes it an easy decision for us.

To accomplish these goals, volunteers from the MED, the local community and Alcoa Foundation plant sizable trees in these low-income communities. They also hold six education events for the public throughout the year, teaching residents how to maintain the trees and all of the benefits that come along with urban canopy. The MED also involves local schools by integrating environmental education into the classroom. Students are given a sapling to plant at their homes, and taught how to take care of their trees.

These efforts have made the initiative an award-winning public campaign for the last nine years straight. This year, they add on another objective: the rehabilitation of a sand mine. Previously used to provide sand for city streets during winter, this 2-acre lot will be restored with 1,250 saplings.

American Forests and Alcoa Foundation have been working in Massena since 2011, and are inspired by the local commitment to urban reforestation. The total scope of this year’s project includes the 1,250 saplings to be planted in the sand mine, roughly 100 more fully grown trees for planting in underserved communities, and all of the educational events. Species to be planted are red maple, sugar maple, northern red oak and malus.

The post More Than a Utility appeared first on American Forests.

Forests as Carbon Sinks

July 18th, 2017|Tags: |0 Comments

.fusion-fullwidth-1 {
padding-left: px !important;
padding-right: px !important;
}

By Melanie Friedel, American Forests

Look at all that carbon sinking! Credit: Max Pixel

Don’t be fooled by the name; a carbon sink is not where we go to wash carbon. Actually, it’s something found in nature that holds or stores carbon — technically anything that absorbs more carbon that it releases.

Forests are great examples. In fact, U.S. forests alone store 14 percent of all annual carbon dioxide (CO2) emissions from the national economy. But how does it happen? You may know that trees survive by performing a process called photosynthesis, in which the tree actually consumes CO2. Being absorbed by trees is just one way that carbon moves through forests as part of the carbon cycle. This cycle is the process by which carbon travels from the atmosphere into the Earth and its organisms, and then travels back into the atmosphere.

During photosynthesis, trees and plants “sequester,” or absorb, carbon from the atmosphere in the form of CO2, using it as food. The chemical equation for photosynthesis is: 6 CO2 (the carbon they take in) + 6 H2O (the water they absorb) + sunlight = C6H12O6 (a sugar called glucose) + 6 O2 (the oxygen they release). The carbon from the CO2 becomes part of the plant and is stored as wood. Eventually, when the plant or tree dies, the carbon it has been storing is released into the atmosphere. This, however, is not the only route carbon can take back into the atmosphere.

Credit: S. Luyssaert et-al.

Humans and other animals eat plants, thereby taking in the carbon that has become part of the plant. Then, we breathe. (And we can thank trees for that — not only do trees take up the carbon we don’t want, but they also provide us with the oxygen we need to survive!) Our breathing process is called cellular respiration, and it looks like this: C6H12O6 (the glucose from the plant) + 6 O2 (the oxygen we breathe) = 6 CO2 (the carbon we release) + 6 H2O (the water vapor we release when we breathe) + ATP (the energy that our cells use to keep working). During that process, we release back into the atmosphere the same carbon that the plant absorbed in the first place, thus continuing the cycle of the carbon.

So if plants and trees eventually contribute to the release of carbon, then how are they considered carbon sinks? Good question. Forests aren’t always carbon sinks; they can sometimes be a carbon source. When a forest releases more carbon than it absorbs, such as during a forest fire or when there are more dead than living trees, it is a carbon source. But in most other cases, forests absorb more than they release, making them carbon sinks.

We prefer forests to be carbon sinks, because too much CO2 in the atmosphere is bad for air quality and human health. Carbon dioxide is a greenhouse gas that traps heat in the lower levels of the atmosphere and contributes to climate change’s trend of globally increasing temperatures. CO2 is not just released by cellular respiration: The main source of CO2 emission is the combustion of fossil fuels by industry and cars. A lot of the carbon produced by these activities is just being introduced into the atmosphere for the first time, even though it will remain cycling through it forever. In 2007 alone, 8.5 billion tons of carbon were added to the carbon cycle by oil, coal, and gas combustion, but before then, it was all being stored underground, far away from the atmosphere where it now exists.

Fossil fuel emissions will require a concentrated effort to offset. Photo Credit: Martin Meissner

Planting trees and conserving forests is an important step towards reducing our carbon footprint, but it won’t do the job on its own. Carbon release from forests can occur at any time if triggered by deforestation, tree decay, forest fires or decomposition of other organic matter. Keeping in mind that carbon will not be stored in trees forever and that the overall carbon levels will keep increasing if emissions do, it’s crucial that we do our job of reducing our carbon emissions and our dependence on fossil fuels in addition to keeping our forest carbon sinks healthy and safe, so that they can do their job too.

The post Forests as Carbon Sinks appeared first on American Forests.

Eastern Seed Zone Forum Open

Capture.JPGThe USDA Forest Service Reforestation, Nurseries, and Genetic Resources team has been assigned the task of determining how best to develop seed zones for Region 9, the Northeastern Area, and the Southern Region. These seed zones are being developed to help the National Forest System address sustainable forest management and ecosystem restoration challenges related to climate change in a uniform manner across regional and political boundaries. These seed zones should be developed in a manner encourages their adoption by state partners, the Department of Agriculture (USDA), Department of Interior (DOI), state forestry agencies, NGOs, seed producers, land managers, and other interested groups or individuals.

A new website was developed for the Forum as a platform for information, a place to host a webinar series, and for regional groups to collaborate. The Seed Zone Forum team will review the literature supplied by top scientists, and consult with on-the-ground regional teams to develop zones that are biologically relevant, but also administratively feasible. The team invites natural resource professionals, or conservation practitioners, from public agencies (federal, state, county, etc), universities, NGOs and industries to help in this endeavor. Public webinars, forums and meetings will be held culminating in a final report to help determine the new seed zones.

Life Thrives in Death Valley

July 14th, 2017|Tags: |0 Comments

.fusion-fullwidth-1 {
padding-left: px !important;
padding-right: px !important;
}

By Allie Wisniewski, American Forests

Death Valley, Calif.: America’s driest national park and one of the hottest places in the world at the peak of summer. In fact, it was at Death Valley’s Furnace Creek that the highest air temperature in history (134° Fahrenheit) was recorded in 1913. With these kinds of credentials, I don’t blame you for wondering who or what could possibly live in such an extreme environment. The name itself brings to mind a vision of grim and desolate wilderness.

The National Park Service is keen to correct this misconception, stating, “Despite its reputation as a lifeless wasteland, Death Valley National Park contains a great diversity of plants.” Lower elevations boast a vast variety of vegetation including desert holly, mesquite and creosote bush, while higher points are covered in blackbrush, Joshua tree, pinyon-juniper, limber pine and bristlecone pine, to name a few. Of course, an assortment of cacti and succulents flourish in the area, including the grizzly bear pricklypear, California barrel cactus, Mojave mound cactus and pickleweed. Even wildflowers like the indigo bush and the golden evening-primrose bloom in the desert sun, adding splashes of color to the often washed-out landscape.

Creosote. Credit: Nate2b/Flickr

Joshua trees. Credit: Christopher Michel

A diverse community of animals also makes its home in Death Valley’s scorching conditions, which is a particularly impressive feat considering the region’s lack of an abundant water supply. Many areas of the park, specifically the basins below sea level, receive less than two inches of rain per year. The animals that live here rely on special adaptations that allow them to survive (and even thrive!). The bighorn sheep, for example, can drink numerous gallons of water at a time when it becomes available, and then lose a third of its body weight in the next several days due to dehydration. Kangaroo rats, on the other hand, don’t even need to drink water, as their vegetarian diet provides sufficient hydration.

What about the heat? Well, a few species like roadrunners and jackrabbits are able to brave the daytime sun with their naturally high body temperatures and heat-releasing oversized ears. On top of that, most desert animals such as coyote are strategically nocturnal, allowing them to rest and save energy during the day, emerging to hunt at dawn and dusk when it is significantly cooler.

Bighorn sheep. Credit: Josh More

A roadrunner. Credit: Beverly Houwing

Want to see this otherworldly desert habitat for yourself? While visitors are welcome to explore the park, the National Park Service advises you not to attempt to “help” the native animals by feeding or interacting with them in any way, and insists that they are “perfectly designed” to live in Death Valley. It sure seems that way. When it comes to this fascinating land of extremes, the NPS said it best: “Towering peaks are frosted with winter snow. Rare rainstorms bring vast fields of wildflowers. Lush oases harbor tiny fish and refuge for wildlife and humans. Despite its morbid name, a great diversity of life survives in Death Valley.”

The post Life Thrives in Death Valley appeared first on American Forests.

National Cattle Comfort Advisor Available Now

Oklahoma Mesonet has released a National version of their popular Cattle Comfort Advisor Tool which provides up to the hour projections on cattle comfort across the United States. A webinar about this tool is available on the USDA-NIFA Funded Great Plains Grazing Coordinated Agricultural Project (Grazing CAP) website. 

Capture.JPG

From Mesonet: “The Oklahoma Mesonet has expanded its Oklahoma Cattle Comfort Advisor to a national tool with the launch of the National Cattle Comfort Advisor. National cattle heat/cold stress maps are updated hourly and archived back to January 1, 2016. These national stress maps help cattle producers: monitor stress conditions using local environmental conditions, guide cattle water demand decisions, track weather changes that increase cattle health risk, track stress over multiple days, monitor severity of extreme weather events, monitor when to avoid working cattle, and know when transported cattle came from an area with weather stress. With no national database of solar radiation, the National Cattle Comfort Advisor calculates heat/cold stress at 100%, 60%, and 20% sunlight levels each hour. Users select the sunlight level map that best fits their local conditions. There are also national maps of 1.5 meter air temperature, 2 meter relative humidity, 2 meter wind speed estimated from 10 meter wind speed data, and estimated solar radiation in watts per meter squared for each sunlight level. The National Cattle Comfort Advisor is based on the ‘Comprehensive Climate Index’ formula for livestock stress from Mader et. al. 2010. Air temperature, relative humidity, and wind data are from National Weather Service METAR dataset.”


Playing With Death

July 13th, 2017|0 Comments

.fusion-fullwidth-2 {
padding-left: px !important;
padding-right: px !important;
}

By Melanie Friedel, American Forests

An infected tree. Credit: Evelyn Simak

Interested in other nature-friendly apps for your iPhone? Check out these 7 free apps for Hikers, Birders and Nature Lovers.

What if you could go Pokémon hunting and save an animal for every Pokémon you catch? Well, that game hasn’t been created yet. But this one has! You can save a tree just by playing a game called Fraxinus: the app that can save the dying ash tree population of the UK.

Players earn points walking through forests and matching up leaf color sequences they see on trees with images on their phones. Each pattern corresponds to a specific genetic sequence, and behind the screens, scientists examine the genetic makeup of trees, analyzing what makes some trees more vulnerable to the fatal fungal infection and others more resistant. This also sends the scientists the locations of each examined tree, helping them build a database mapping the health of their forests and where interventions are necessary.

The name “Fraxinus” comes from the ash tree’s Latin name, Fraxinus excelsior. When Fraxinus players match up their ash tree with an option on their screen, they submit a photo and tag it with an AshTag. As more players run into the same tree and tag it again and again, each player who has previously tagged it can track its progress over time, while scientists simultaneously watch the disease progress in individual trees and devise a prevention plan.

The disease is spreading quickly through both the wind and mechanical transportation of infected trees, killing younger trees shortly after infection and weakening older trees that then become vulnerable to other threats. Almost 42% of all 10-square-kilometer areas in the UK have already been affected. With such a wide spanning area affected by Hymenoscyphus fraxineus, the fungus causing the dieback, it might seem impossible to collect enough data on the genetic sequences of affected trees, but with thousands of players inputting data every day, it’s finally feasible to find a solution.

With enough tree photos, locations, and pattern matches submitted by players, the scientists working on the project hope to find a gene pattern that makes ash trees resistant to the fungus and repopulate the forests with this variation. So if you feel like being productive and saving a forest, get up, go out, and start playing on your phone!

The post Playing With Death appeared first on American Forests.

Climate Sensitivity Estimates and Corrections

You need to be careful in inferring climate sensitivity from observations.

Two climate sensitivity stories this week – both related to how careful you need to be before you can infer constraints from observational data. (You can brush up on the background and definitions here). Both cases – a “Brief Comment Arising” in Nature (that I led) and a new paper from Proistosescu and Huybers (2017) – examine basic assumptions underlying previously published estimates of climate sensitivity and find them wanting.

Last year, there was a paper that described a new composite record of temperatures going back 2 million years (Snyder, 2016). As we discussed at the time, those results were used to conclude that the Earth System Sensitivity (the total response to a doubling of CO2 after the short and long-term feedbacks have kicked in) was around 9ºC — much larger than any previous estimate (which is ~4.5ºC) — and inferred that the committed climate change with constant concentrations was 3-7ºC (again much larger than any other estimate – most are around 0.5-1ºC). We posted a discussion about why (even in principle) this was not a good methodology for estimating ESS. Well, now there is a Brief Comment Arising (and a rather combative response) published in Nature.

As simple as possible (but no simpler)

The essence of the comment is a model that we put together that (I think) is the simplest that you can derive that includes a carbon cycle, ice sheets, and allows for the standard ‘Charney’ sensitivity (ECS) and the ESS to vary independently. The documentation and R code for the model is part of the supplementary material, as is a Jupyter notebook for a python version (so knock yourself out if you want to explore it further). What this model shows is that if orbital variations in insolation impact ice sheets directly in any significant way (which evidence suggests they do Roe (2006)), then the regression between CO2 and temperature over the glacial-interglacial cycles (which was used in Snyder (2016)) is a very biased (over)estimate of ESS. The results from this model demonstrate clearly (and in line with our initial criticisms) that the Snyder (2016) suggestion of a very high ESS and committed warming is unfounded.


Relationship between the CO2/T regression and the actual ESS for two specific cases of our simple model when you run it with an 80,000 year orbital cycle. The ratio in the right hand figure and is almost everywhere greater than one, implying an overestimate when using the regression.

The second example follows a few other papers in challenging the assumptions behind constraints on the Charney sensitivity derived from historical changes in temperature and forcings. These transient constraints have tended to come in lower than the other estimates based on paleo-climate or emergent constraints, and thus have been embraced by (let’s say) more ‘optimistic’ commentators (though until the mismatches are resolved it would be premature to only favor only one class of results).

The basic issue looked at in Proistosescu and Huybers (2017), is the model result that suggests that there is a time dependence in the evolution to equilibrium. Others have identified the lags in the southern ocean (which warms more slowly than the northern hemisphere, and northern land in particular) as the source of this time dependence of feedbacks, and we’ve demonstrated that different forcings have subtly different impacts – to some extent based on their spatial signatures. This implies that analyses in the early part of a transition to a new equilibrium will give lower sensitivities than they should.

One persistent (yet sometimes interesting) critic of these results is Nic Lewis (a few previous cases), and he has attempted to dismiss these results as well. The common thread in his criticisms is that these results are based on behaviour seen in models. However, these models are much more complex and better validated than the 1-D energy balance model used in these constraints, so the more correct view is that the simplistic assumptions needed in his approach don’t seem to work in more sophisticated set-ups, and thus are unlikely to be valid in the real world. These effects may not be perfectly captured in the CMIP5 ensemble or in any specific model, but that doesn’t justify assuming that they are zero with zero uncertainty.

The overall conclusion to be drawn is that both very low (5ºC) of sensitivity can likely be ruled out by recourse to a wider set of data. Hopefully those constraints will get narrower as we get make more progress, but the current range has stood the test of time for good reasons.

References


  1. C. Proistosescu, and P.J. Huybers, “Slow climate mode reconciles historical and model-based estimates of climate sensitivity”, Science Advances, vol. 3, pp. e1602821, 2017. http://dx.doi.org/10.1126/sciadv.1602821


  2. C.W. Snyder, “Evolution of global temperature over the past two million years”, Nature, vol. 538, pp. 226-228, 2016. http://dx.doi.org/10.1038/nature19798


  3. G.A. Schmidt, J. Severinghaus, A. Abe-Ouchi, R.B. Alley, W. Broecker, E. Brook, D. Etheridge, K. Kawamura, R.F. Keeling, M. Leinen, K. Marvel, and T.F. Stocker, “Overestimate of committed warming”, Nature, vol. 547, pp. E16-E17, 2017. http://dx.doi.org/10.1038/nature22803


  4. G. Roe, “In defense of Milankovitch”, Geophysical Research Letters, vol. 33, 2006. http://dx.doi.org/10.1029/2006GL027817


  5. K.C. Armour, “Projection and prediction: Climate sensitivity on the rise”, Nature Climate Change, vol. 6, pp. 896-897, 2016. http://dx.doi.org/10.1038/nclimate3079