A bright future for Kirtland’s warbler in the Northern Great Lakes

April 18th, 2017|Tags: , , , |0 Comments

.fusion-fullwidth-1 {
padding-left: px !important;
padding-right: px !important;
}

By Justin Hynicka, Manager of Forest Conservation

I have a love-hate relationship with red-eye flights. On one hand, they maximize daylight on day one to explore my destination, which I love. On the other hand, it usually takes a day or two to shake off the cobwebs from poor sleep, which I don’t love. As if one night isn’t hard enough, just imagine taking a red-eye flight for two weeks straight. Oh, and you are also the pilot.

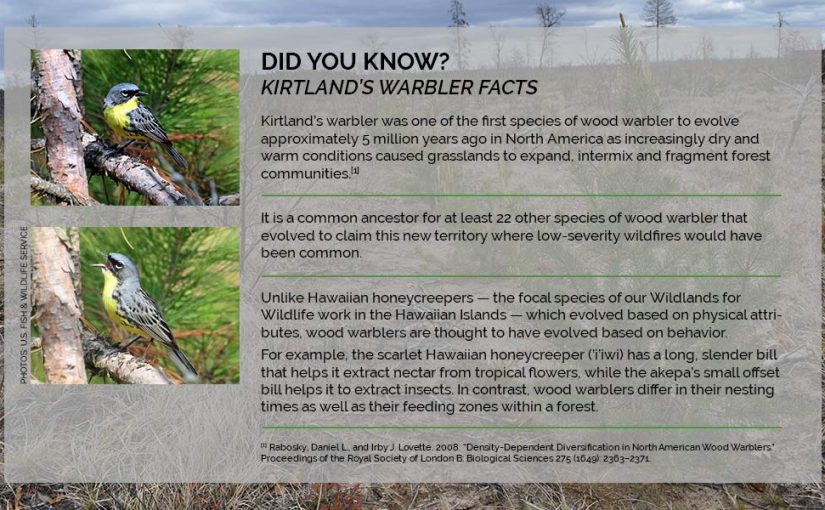
This is the journey the Kirtland’s warbler (KW; Setophaga kirtlandii) makes twice a year, traveling 1,700 miles in 16 days from the Bahamas to Michigan in spring, and back again in fall.[1] Even though KWs pass though many eastern states, they are rarely seen outside of their wintering and breeding areas due to a low-but-rising population and because they migrate at night. After such a journey, it’s hard to blame them for being one of only a few warblers to nest on the ground.

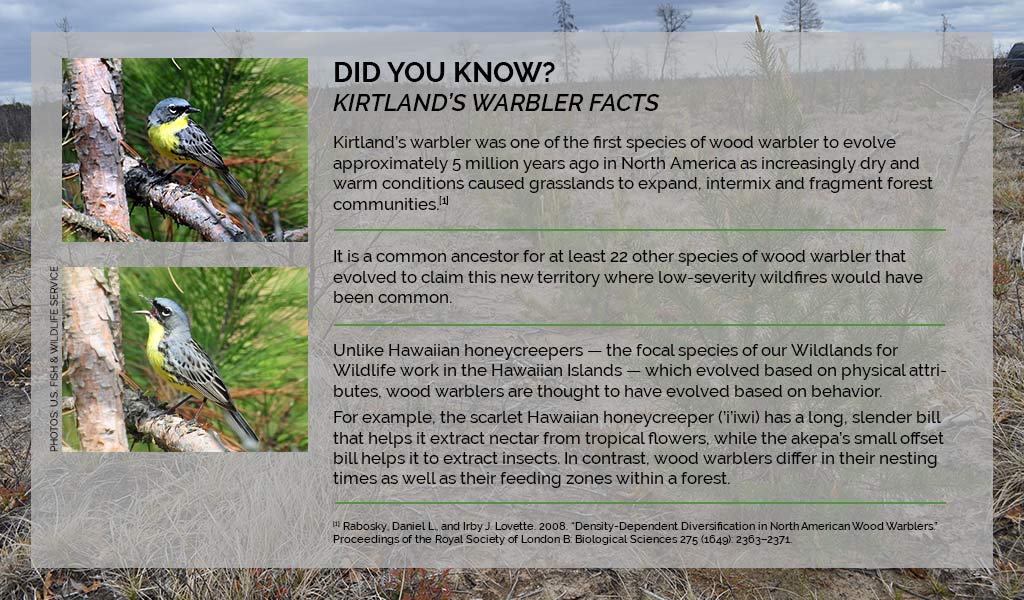
Today, in a region once again dominated by closed-canopy forests, prime KW breeding habitat includes a limited patchwork of dry, low-fertility and fire-prone lands in Michigan. This already limited breeding range, combined with modern wildfire suppression policies, interrupted a cycle critical to KWs and caused its population to plummet, leading to federal protection under the Endangered Species Act in 1973.

Conservation efforts over several decades have expanded the warbler’s population from approximately 400 to more than 4,000 birds.[2] American Forests’ very first Global ReLeaf project in 1990 created KW habitat in Michigan’s Au Sable State Forest and, in total, we have planted 2.3 million trees across 2,600 acres in wildlands projects specifically for KW habitat in Michigan. We have also helped restore another 1,500 acres of potential KW habitat close to new breeding locations in Wisconsin.

Beginning in 2017, we are significantly stepping up our commitment to recover KW through a five-year partnership with Michigan Department of Natural Resources that will plant 5 million trees on more than 4,000 acres. Without wildfire, older jack and red pine must be harvested and clear-cut areas replanted with seedlings, because only fire or extremely hot summer days will soften the sticky, resin-covered pinecones enough to release the seeds. While some revenue is made from harvested trees, in this region it is rarely enough to offset the cost of replanting. In the first year of our partnership, six sites in Gaylord, Greyling and Roscommon State Management Units will receive restoration plantings accounting for 25 percent of the statewide annual restoration goal.

In addition, American Forests is partnering with the Canadian Wildlife Service to kick-start Kirtland’s warbler habitat restoration efforts in Ontario. There are a couple of known breeding locations in the province, but a lack of suitable habitat is limiting their recovery. As climate change shifts habitats northward, jack pine restoration in Ontario may become important to the continued recovery of Kirtland’s warbler.

Vote for the Northern Great Lakes

Do you live in or near the Northern Great Lakes, or simply find the Kirtland’s warbler captivating? Then vote today or by 10:00 a.m. EDT on April 26, and the winning region will receive an additional $10,000 project investment in 2018!

Vote for your favorite wildlife


[1] Cooper, Nathan W., Michael T. Hallworth, and Peter P. Marra. 2017. “Light-Level Geolocation Reveals Wintering Distribution, Migration Routes, and Primary Stopover Locations of an Endangered Long-Distance Migratory Songbird.” Journal of Avian Biology 48 (2): 209–219.

[2] U.S. Fish and WIldlife Service. “Kirtland’s Warbler Census Results: 1951 to 2015.” 2016. https://www.fws.gov/midwest/endangered/birds/Kirtland/Kwpop.html.

The post A bright future for Kirtland’s warbler in the Northern Great Lakes appeared first on American Forests.

Future of the grizzly bear in Northern Rockies and Cascades

April 13th, 2017|Tags: , , , |0 Comments

.fusion-fullwidth-1 {
padding-left: px !important;
padding-right: px !important;
}

By Eric Sprague, Director of Forest Conservation

The North Cascades Ecosystem in Washington State is one of the most intact ecosystems in the Lower 48. Gray wolf, Canada lynx, elk and golden eagle all still roam the landscape. Although, arguably the most iconic western animal, the grizzly bear, has not been confirmed in the region since 1996.

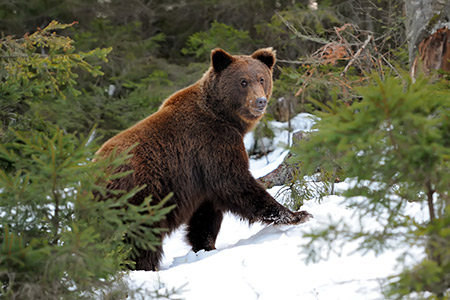
Grizzlies are found both to the east in Idaho and Montana and the north in Canada, but have not established in the North Cascades despite favorable habitats. To prevent grizzlies from going extinct in the region, federal agencies are currently accepting comments through April 28, 2017 on a number of alternatives that include reintroducing the grizzly to the North Cascades Ecosystem.

If grizzly bears do return, they will find that one of their favorite fall food sources is in limited supply. When whitebark pine cones are abundant in these high-elevation forests, grizzly bears can feed almost exclusively on the seeds, making them important to survival for winter hibernation and keeping the bears in wildland forests instead of human communities.

Despite the region’s remoteness, whitebark pine trees are sustaining heavy losses from white pine blister rust, successive waves of mountain pine beetle and the impact of fire suppression. All of these threats are further fueled by climate change, stressing a hardy tree to its limits. In 2011, the U.S. Fish and Wildlife Service designated whitebark pine as a candidate species under the U.S Endangered Species Act (ESA). The agency is currently reevaluating the tree’s status. Whitebark pine was listed in 2012 as “endangered” under Canada’s Species at Risk Act. If listed in the U.S., whitebark pine would be the most-widely distributed tree under ESA protection.

Whitebark pine tree with the “red flagging,” a symptom of blister rust infection.

Whitebark pine tree with the “red flagging,” a symptom of blister rust infection.

The latest research shows that whitebark pine may be able to respond to fire and drought and adapt to climate change. The catch is that the ecosystem’s ability to adapt in the future is dependent on restoration actions we take now. Through our Wildlands for Wildlife initiative, American Forests is restoring whitebark pine forests to benefit the grizzly bear and protect the many other services these ecosystems provide, including storing water and helping forests bounce back from wildfires.

In 2017, we will continue to support projects in the North Cascades and the development and planting of blister rust resistant seedlings over 300 acres in priority locations in the Greater Yellowstone Ecosystem and Crown of the Continent region in Montana and Canada.

Furthermore, American Forests is partnering with the U.S. Forest Service and Whitebark Pine Ecosystem Foundation to develop a national restoration plan to guide whitebark pine restoration activities and investments over the next several years.

Endangered species recovery and habitat conservation go hand-in-hand. American Forests is committed to conserving the grizzly bear and the whitebark pine ecosystem that it depends on.

Vote for the Northern Rockies and Cascades

Do you live in or near the Northern Rockies and Cascades, or just love grizzly bears? Then vote today or by 10:00 a.m. EDT on April 26, and the winning region will receive an additional $10,000 project investment in 2018!

Vote for your favorite wildlife

The post Future of the grizzly bear in Northern Rockies and Cascades appeared first on American Forests.

Vice President of Development

.fusion-fullwidth-2 {
padding-left: px !important;
padding-right: px !important;
}

Department

Development

Reports to

President & CEO

Supervises

  • Director of Major Gifts
  • Director of Corporate Giving
  • Manager of Individual Giving
  • Database Manager

Salary

Commensurate with experience.

FLSA Status

Exempt

Summary

Reporting to the President & CEO, the Vice President (VP) of Development serves as a key leadership team member and an active participant in making strategic decisions affecting American Forests. In partnership with the President & CEO, this position is responsible for all fundraising and development activities. The successful candidate will help forge new relationships to build American Forests’ visibility, impact and financial resources. The VP of Development also will design and implement a comprehensive plan for developing key external alliances by cultivating individual and philanthropic support.

The VP of Development will have primary responsibility for establishing and implementing the infrastructure needed to grow a $5.5 million budget through the solicitation of major gifts, membership, and corporate and foundation support. She or he will expand and diversify American Forests’ donor base/pipeline and work closely with other team members to secure funding for new initiatives. In addition, the VP will work closely with the board of directors and support board members as they take on a more active fundraising role.

It is expected that the amount raised by American Forests will increase in future years as the VP of Development systematically and effectively strengthens the organization’s overall fundraising capacity.

Requisite Education Or Certifications

Bachelor’s degree required.

Required Experience

10-plus years of professional experience in a nonprofit organization with demonstrated success in a senior development function (managing and forging relationships with multiple donor sources). Tangible experience of having expanded and cultivated existing donor relationships over time. Excellent communication skills, both written and oral. Ability to influence and engage a wide range of donors and build long-term relationships. Strong organizational skills. Flexible and adaptable style. Leader who can positively impact both strategic and tactical fundraising initiatives. Ability to work both independently without close oversight, but also a team player who will productively engage with others at varying levels of seniority within and outside American Forests. High energy and passion for American Forests’ mission is essential.

Working Conditions

Significant travel and some public speaking will be required. General office work environment. American Forests is located in downtown Washington, D.C., within walking distance of Metro stations on all lines, multiple bus lines, and Capital Bikeshare.

Specific Responsibilities

  • In cooperation with the CEO and board, lead American Forests’ fundraising efforts.
  • Support and partner with the CEO and board members on key fundraising initiatives.
  • Collaborate with the Chief Operating Officer to develop and implement American Forests’ financial strategy.
  • Manage and grow our corporate partners program. Develop and implement strategies to research, prospect and close on new corporate relationships. Retain and upgrade existing corporate partner relationships. Develop and implement value added, mutually beneficial co-marketing and brand-building efforts.
  • Support the CEO in advancing board recruitment and philanthropy.
  • Grow major gifts program, planning and executing customized strategies to cultivate, solicit, steward and close major and endowed gifts.
  • Consistently expand our general and Sequoia Circle memberships, leading the direct marketing program, retaining and managing vendors, and developing and approving all direct marketing initiatives.
  • Lead the foundation grant development program, collaborating with the CEO, conservation programs, and communications teams.
  • Oversee research funding sources and trends, with foresight, to help position American Forests ahead of major funding changes or trends.
  • Monitor all donor information; provide and present statistical analysis to board and senior leaders.
  • Develop and implement a stewardship program aimed at cultivating deeper ties with donors.
  • Monitor and report regularly on the progress of the development program.
  • Identify, develop and mentor the development team.
  • Serve as an engaged and collaborative member of the senior team, helping to provide overall leadership to the organization.

To Apply

To apply, send a cover letter and resume to Scott Steen, President & CEO, at jobs@americanforests.org.

The post Vice President of Development appeared first on American Forests.

10 Most Instagrammable Locations for a Treehugger

April 12th, 2017|Tags: |0 Comments

.fusion-fullwidth-1 {
padding-left: px !important;
padding-right: px !important;
}

By Kate Kirlin, American Forests

These 10 places around the world are prime locations for all Instagram-loving treehuggers! From Sequoia National Park to New Zealand, check out these places for your next top post.

(And if you aren’t already, follow American Forests on Instagram for some beautiful forest and wildlife photos!)

1. Ballymoney, Northern Ireland

Credit: Lindy Buckley

These beech trees, known as The Dark Hedges, were planted by the Stuart family in the 18th century to line the road to their mansion estate, Gracehill House. Over the years, the trees’ branches have become intertwined, creating a mysteriously beautiful overhang.

2. Ashikaga Flower Park, Japan

Credit: Manish Prabhune

An old wisteria tree in this park has branches so vast and heavy that they have to be held up by steel rods. When it blooms, it creates a pinkish-purple canopy over tourists’ heads. Visitors are encouraged to visit from mid-April to mid-May, when the tree’s blossoms are at their peak.

3. Sequoia National Park, California

Credit: Jim Bahn

The forests in this famous national park are filled with some of the tallest trees in the world. The largest known single stem tree, named General Sherman, is more than 270 feet tall.

4. Keahua Arboretum, Kauai, Hawaiʻi

Credit: Amelia via Flickr

Rainbow eucalyptus is a truly unique tree. The trees shed their bark annually, revealing vibrant colors underneath. It can also grow up to six feet a year!

5. Tidal Basin, Washington, D.C.

Credit: Scott Bauer/USDA

From the last week in March to early-April, gorgeous pink cherry blossom trees bloom around the historic Tidal Basin in the nation’s capital. Since their exact peak bloom dates vary year to year depending on the weather, it can be difficult to plan a trip to see these beautiful trees.

6. Inyo County, California

Credit: Rick Goldwaser

An ancient bristlecone tree, named Methuselah, resides in a grove in the White Mountains of Inyo County. The exact location of this tree is unknown to the public for safety reasons, but the tree is believed to be nearly 5,000 years old.

7. Johns Island, South Carolina

The Angel Oak, located near Charleston, is estimated to be over 400 years old. Its branches produce shade that covers 17,200 square feet!

8. Madagascar

Credit: Zigomar

The baobab trees of Madagascar are also known to many as a “tree of life.” Animals are known to chew baobab bark during the dry seasons because of the tree’s stored water reserves. They have also been used for shelter, medicine and traditional cultural ceremonies.

9. Slope Point, New Zealand

Credit: itravelNZ

The windswept trees of Slope Point are permanently bent from the winds blowing upwards from Antarctica. Though not accessible by road, the trees of New Zealand’s southern-most tip of the Southern Island can be reached by a 20-minute walk guided by trail markers.

10. Brocéliande Forest or Paimpont Forest, Brittany, France

Credit: Johann Dréo

This area, known by two names, is associated with the legends of King Arthur and the wizard Merlin. This primeval forest is home to some of the oldest trees in Brittany. A dead gold leaf-covered tree, gilded by an artist, stands among five blackened trees. These trees were the last burning trees in a devastating fire in 1990. The Golden Tree is a symbol of rebirth for the forest.

The post 10 Most Instagrammable Locations for a Treehugger appeared first on American Forests.

Model projections and observations comparison page

We should have done this ages ago, but better late than never!

We have set up a permanent page to host all of the model projection-observation comparisons that we have monitored over the years. This includes comparisons to early predictions for global mean surface temperature from the 1980’s as well as more complete projections from the CMIP3 and CMIP5. The aim is to maintain this annually, or more often if new datasets or versions become relevant.

We are also happy to get advice on stylistic choices or variations that might make the graphs easier to comprehend or be more accurate – feel free to suggest them in the comments below (since the page itself will be updated over time, it doesn’t have comments associated with it).

If there are additional comparisons you are aware of that you think would be useful to include, please point to the model and observational data set(s) and we’ll try and include that too. We should have the Arctic sea ice trends up shortly for instance.

What is the uncertainty in the Earth’s temperature rise?

Guest commentary by Shaun Lovejoy (McGill University)

Below I summarize the key points of a new Climate Dynamics (CD) paper that I think opens up new perspectives on understanding and estimating the relevant uncertainties. The main message is that the primary sources of error and bias are not those that have been the subject of the most attention – they are not human in origin. The community seems to have done such a good job of handling the “heat island”, “cold park”, and diverse human induced glitches that in the end these make only a minor contribution to the final uncertainty. The reason of course, is the huge amount of averaging that is done to obtain global temperature estimates, this averaging essentially averages out most of the human induced noise.

Two tough sources of uncertainty remain: missing data and a poor definition of the space-time resolution; the latter leads to the key scale reduction factor. In spite of these large low frequency uncertainties, at centennial scales, they are still only about 13% of the IPCC estimated anthropogenic increase (with 90% certainty).

This paper is based on 6 monthly globally averaged temperature series over the common period 1880-2012 using data that were publically available in May 2015. These were NOAA NCEI, NASA GISTEMP, HadCRUT4, Cowtan and Way, Berkeley Earth and the 20th Century Reanalysis. In the first part on relative uncertainties, the series are systematically compared with each other over scales ranging from months to 133 years. In the second part on absolute uncertainties, a stochastic model is developed with two parts. The first simulates the true temperatures, the second treats the measurement errors that would arise from this series from three different sources of uncertainty: i) usual auto-regressive (AR)-type short range errors, ii) missing data, iii) the “scale reduction factor”.

The model parameters are fit by treating each of the six series as a stochastic realization of the stochastic measurement process. This yields an estimate of the uncertainty (spread) of the means of each series about the true temperature – an absolute uncertainty – not simply the spread of the series means about their common mean value (the relative uncertainty). This represents the absolute uncertainty of the series means about a (still unknown) absolute reference point (which is another problem for another post).

Key science

  1. The usual uncertainties have short-range auto-regressive correlations, so that when averaged over long enough periods, the differences between series will eventually be close to white noise. This is presumably the main type of error that we could expect if there were the usual human glitches caused by changing station locations, technologies and the like; the usual sources of human bias. The corresponding fluctuations fall off relatively rapidly with time interval \Deltat: as \Deltat-1/2. This type of behaviour is never observed even at scales of a century (see figs. 1, 2; Haar fluctuations were used, see the note at the bottom). If this type of error were indeed dominant, then the centennial scale differences between the series would be about ±0.005oC, which is about ten times smaller than those we calculate.

  2. Fig. 1: The Root Mean Square (RMS) Haar fluctuations (structure functions S(\Deltat)) averaged over the six series (top), averaged over all the 15 pairs of differences (second from top), averaged over the differences of each with respect with the overall mean of the six series (third from top), and the standard deviation of the S(\Deltat) curves evaluated for each of the series separately (bottom). Also shown for reference (dashed) is the line that data with independent Gaussian noise would follow (Adapted from fig. 2).


    Fig. 2: The top set of curves (solid) are S(\Deltat) for each of the different series, the bottom set (dashed) are the differences of each with respect to the mean of all the others: NOAA dark purple, NASA (brown), HadCRUT4 (green), Cow (blue), 20CR (orange), Berkeley Earth (red) (indicated at the left in the order of the curves). Adapted from fig. 3 of CD.

  3. All the series seemed to be both statistically very similar to each other and each was pretty much equally distant from the mean of all the others (i.e. equally similar or dissimilar to each other, depending on your view). Significantly, this included the 20th Century Reanalysis (20CR) that didn’t use any land temperature station data whatsoever (fig. 2) and even turned out to be the closest (with NOAA) to the mean of all the others!
  4. Up until a scale of about 10 years (the “macroweather” regime), the fluctuations in the series and in the differences between the series have different amplitudes (the ratio is between 2 and 3), but both are scaling with roughly the same fluctuation exponent H ≈ -0.1 (fig. 1, 2).   This implies strong long-range statistical dependencies (long range memories) in both the series themselves and in their differences. The obvious interpretation is that over this range of scales that each of the series are missing data (typically about 50% of pixels have no data), but each series misses somewhat different data.
  5. For scales longer than about 10 years, the global temperature fluctuations begin to increase with time scale: the internal macroweather variability is increasingly dominated by low frequency changes due to anthropogenic warming: this is the beginning of the climate regime. At the same time, the fluctuations in the differences between the series stops following the fluctuations in the series themselves, leveling off at about ±0.05oC (fairly independently of the time scale). This is a kind or irreducible uncertainty (figs. 1, 2).
  6. These differences below about (10 yrs)-1, can be explained by poorly defined space-time data resolutions. Fig. 4 in CD shows that the amplitudes of the fluctuations are quite sensitive to the amount of space-time averaging and they systematically decrease with the averaging scale according to somewhat different exponents in both space and in time.

    Let’s say that the basic data were gridded at 5o resolution in space and at one month in time.  In that case, there is a typical amplitude of 5o x 5o x 1 month space-time temperature fluctuation, but since there are generally insufficient data in each 5o x 5o x 1 month “space-time box” they are not perfectly estimated, there is not enough data to sufficiently average it over the nominal space-time scales. Because the fluctuation exponents in fig. 3 (in both and in time) are negative, this implies that the amplitudes of the fluctuations are spuriously large by a multiplicative factor that depends on the difference between the actual “effective” resolution and the nominal resolution (5o x 5o x 1 month). This is the origin of the scale reduction factor and it has the particularity of being multiplicative: it affects all scales. This is the dominant source of error at scales beyond a decade. It gives the dominant contribution to errors in estimating anthropogenic warming.

    This effect is actually familiar to long-range forecasters who routinely “rescale” model outputs so that the amplitude of the model internal variability is realistic when compared to empirical temperatures. The scale reduction factor is simply the same mechanism but applied to the empirical series themselves.

  7. In order to go beyond relative errors estimated via the series to series differences, to obtain the absolute errors, we constructed a simple stochastic model (fig. 4) of both the actual temperature and the three sources of error: the classical short range error, the missing data term and the scale reduction factor. Using statistical analysis of the fluctuations of the series to series differences, we estimated the statistics of the amplitudes from each contribution (fig. 5). The key results of the paper follow, notably:
    • Up to 10 years, missing data was the main source of error: 15±10% of the temperature variance. The ±10% about the 15% refers to series to series variation in the amount of missing data (these are one standard deviation limits).
    • After ten years, the scale reduction factor was dominant giving an error of 11%±8% error. This is the main source of centennial scale error.
    • Overall, with 90% confidence it was found that the true temperature lies in the range -0.11oC to 0.13oC of the reported monthly values (90% confidence).
    • Overall: the change since the 19th century can be estimated with nearly the same uncertainty as for the monthly value: ±0.11oC (90% confidence).
    • This uncertainty is much higher than conventional (AR type) approaches predict, (about ±0.005oC).
    • All of these numbers are much smaller than the roughly 1oC of warming that has occurred since the 19th century, so that we can be quite confident of the magnitude of the warming.


    Fig. 3: The RMS fluctuations (structure functions, S) of the various measurement errors with one standard deviation limits shown as dashed lines (corresponding the variation from one measurement series to another). The blue curve is the contribution of the scale reduction factor, the red is from missing data (slope = H = -0.1) and the green is the short-range measurement error (slope -1/2). The black curve is the sum of all the contributions. Notice that most of the contributions to the errors are from the scaling parts. These Haar structure functions have been multiplied by a canonical factor of 2 so that the fluctuations will be closer to the anomalies (when decreasing) or differences (when increasing). Note that these show essentially the difference between the true earth temperature and the measurements; the difference between two different measured series will have double the variances, the difference structure function should thus be increased by a further factor 21/2 before comparison with fig. 2, 3 or the figures below. Adapted from fig. 6 of CD.

  8. The stochastic model was able to closely reproduce not only the temperature statistics but also the differences between series, and this at all scales from one month of > 100 yrs. This is a strong validation (see figs. 9, 10, 11 of CD).
  9. The 20CR series is not based on anomalies but absolute temperatures, yet it was statistically just as close to the others as if it had been based on anomalies. We can therefore use it to determine the absolute temperature of the earth; the error estimates in the above paragraph will hold.

Notes:

“Haar fluctuations” are a very simple form of wavelet. A Haar fluctuation \DeltaT(\Deltat) of the temperature T(t) over a time interval \Deltat is simply the average of T(t) over the first half of the interval minus the average over the second half (i.e. the average from T(t) to T(t\Deltat/2) minus the average from T(t– Dt/2) to T(t\Deltat)). That it! The interpretation is simple: when the mean (or RMS) of \DeltaT(\Deltat) is increasing with interval \Deltat, it is close to the mean difference in temperature, when decreasing, it is close to the mean anomaly (here defined as the average over an interval \Deltat of series with the long term mean removed).

The slightly corrected proofs (not subject to copyright) can be found here.

There is a popular summary that was published in The Huffington Post. A French language version may be found in Le Huffington Post

References


  1. S. Lovejoy, “How accurately do we know the temperature of the surface of the earth?”, Climate Dynamics, 2017. http://dx.doi.org/10.1007/s00382-017-3561-9

CLN/ANREP CSI Webinar May 4, 2017, 3:00pm EDT – The Adaptation Workbook

Capture.JPG

Join us on May 4th at 3:00pm EDT when Stephen Handler from USDA Forest Service Northern Research Station and Northern Institute of Applied Climate Science presents The Adaptation Workbook: Building your climate adaptation plan. The Adaptation Workbook is an online, interactive, and practical workbook that helps land managers develop their own custom-built climate change adaptation plans (www.adaptationworkbook.org). This tool is designed to support people who are working on forest management, urban forestry, or agriculture projects anywhere in the USA. This presentation will include a background on the concepts behind the Adaptation Workbook process, a tour of the Adaptation Workbook website, and a few examples to illustrate how this tool is being used in the real world.

Stephen Handler_crop.jpgStephen Handler is a climate change specialist with the USDA Forest Service Northern Research Station and Northern Institute of Applied Climate Science. His main role with NIACS is to coordinate the Northwoods Climate Change Response Framework
, which involves building partnerships, assessing climate change risk, and working with forest managers and landowners to develop real-world projects to adapt and prepare for future change. Stephen moved to Houghton, MI, in 2011 and loves being a Yooper.

Meet Our New Database Manager

April 11th, 2017|0 Comments

.fusion-fullwidth-2 {
padding-left: px !important;
padding-right: px !important;
}

Nora Burke recently joined the American Forests staff as our new database manager. She brings a ton of enthusiasm and experience to the organization — and we thought you should get to know more about her! From memorizing the scientific names of trees to why she is passionate about conservation, learn more about Nora.

  • Why did you choose to go into conservation?
    As a kid in school, I remember hearing about the demise of the rainforest. How the Amazon was losing acreage at an alarming rate, acres that house precious habitat with one-of-a-kind plants, trees and animals. Does anyone else remember the movie Medicine Man? (Am I dating myself?) Kidding aside, that message stuck with me. Coupled with the fact that conservation was an important cause to my parents, it’s a cause I’ve grown up around and am very passionate about.
  • What aspects of American Forests’ work are you most excited to be a part of?
    The new Wildlands for Wildlife program is an exciting way to focus on regional work with a focus on wildlife habitat. We can follow changes in one of seven areas over time to see the progress in the rehabilitation of the habitat. Plus, I’ve always loved the ocelot (I’m a cat lady), and with very few left, I’m hopeful we can help restore the population in the Lower Rio Grande Valley (one of the Wildlands for Wildlife regions).
  • What do you think are the most significant challenges facing forests today?
    Climate change and getting kids off electronics and outside to foster a love and responsibility for the environment.
  • Do you have a favorite story from your years in the field?
    While it isn’t from the field, I love thinking back to my childhood and helping my dad rid our yard of invasive species. Also, a great cross-country road trip with my sister comes to mind, stopping at many national parks along the way.
  • What is your favorite tree and why?
    My dad used to make me memorize the flowers and trees (including the Latin names) surrounding our house. At the time, the American sycamore (Platanus occidentalis) was a favorite of mine because it was an easy one to identify. I thought this would be a fun question to ask my dad seeing as how he tortured me as a child. Without any prompting his reply was: the tuliptree (Liriodendron tulipifera) — large, majestic and self-pruning.

The post Meet Our New Database Manager appeared first on American Forests.

A Century of Too Much Love in the Sierra Nevada Mountains

April 10th, 2017|Tags: , , , |0 Comments

.fusion-fullwidth-1 {
padding-left: px !important;
padding-right: px !important;
}

By Justin Hynicka, Manager of Forest Conservation

The Sierra Nevada Mountains, which rise abruptly from California’s populous Central Valley and cover more than 20,000 square miles, contain one of the most biodiverse temperate conifer forests on Earth. Twenty-six species of conifer trees are native to this region and are distributed in broad elevation zones according to the climatic conditions under which they evolved and adapted.

Maybe we shouldn’t be surprised with all these players, but these forests are suffering from a complicated relationship with a single source: too much love. Like that succulent plant you bought and killed because you watered it too much despite careful instructions from the vendor — only on a vastly larger scale and with more devastating consequences — we’ve safeguarded forests in the Sierra Nevada Mountains too much by allowing too little wildfire.

Low severity wildfires were once common here, re-occurring every 12 to 20 years. Yet, because of past fire suppression polices aimed at safeguarding economic forest resources, less than one percent of forest land has experienced low severity fire over the last 100 years.[1] While more trees grew in the short term, the long-term consequences of this management approach erupted in the early 2000s with more frequent occurrences of highly damaging wildfires that have left portions of these forests without a seed source for miles and turned back the clock on forest development by decades, if not centuries. These conditions threaten the myriad of wildlife that depend on mature forest habitat including the pacific fisher and northern goshawk.

About this same time, American Forests’ tree planting partnerships shifted toward western national forests and other public lands in an effort to address the pressing need for large-scale wildfire restoration through tree planting. Our work in the Sierra Nevada Mountains began in 2001 and regionally we have planted more than 1.6 million trees across 8,000 acres. In 2017, we are partnering with the Eldorado National Forest to initiate restoration across 17,000 acres that were severely burned during the King Fire. One of the most ecologically devastating fires in California history, the King Fire consumed a total of 97,000 acres of public and private land.

While tree planting will always be regionally important, it is clearly time for a break-up with current management policies. There is an estimated 2.5 million-acre backlog of wildfire treatments on federal lands alone in the Sierra Nevada Mountains, with fuel reductions treating roughly 20 percent of the annual historic burn area.[2] This implies that the backlog of wildfire treatments will continue to grow by 450,000 acres per year!

Through our Wildlands for Wildlife initiative, we are excited to continue our longstanding partnership with the U.S. Forest Service and local communities to strategically plant trees in areas devastated by severe wildfire using novel methods in restoration and the best available climate change science. However, we are thrilled to break new ground by undertaking proactive methods of forest restoration that reduce the risk of catastrophic wildfire and are more cost effective than uncompromising wildfire suppression activities.

Vote for the Sierra Nevada Mountains

Do you live in or near the Sierra Nevada Mountains, or simply find the rare Pacific fisher captivating? Then vote today or by 10:00 a.m. EDT on April 26, and the winning region will receive an additional $10,000 project investment in 2018!

Vote for your favorite wildlife


[1] Kocker, Susan. 2012. “Forest Health Carbon Storage.” Sierra Nevada Conservancy. http://www.sierranevada.ca.gov/our-region/sys_ind_docs/SystetmIndicatorsForestHealth.pdf/view.

[2] North, Malcolm, Brandon M. Collins, and Scott Stephens. 2012. “Using Fire to Increase the Scale, Benefits, and Future Maintenance of Fuels Treatments.” Journal of Forestry 110 (7): 392–401.

The post A Century of Too Much Love in the Sierra Nevada Mountains appeared first on American Forests.

Forest Digest — Week of April 3, 2017

April 7th, 2017|Tags: |0 Comments

.fusion-fullwidth-1 {
padding-left: px !important;
padding-right: px !important;
}

Find out the latest in forest news in this week’s Forest Digest!

The dogwood’s “petals” are actually modified leaves called bracts, which surround a cluster of tiny yellow flowers and attract pollinators. Credit: Robert Owen

  • World is home to ‘60,000 tree species’BBC News
    According to a new, comprehensive study of the world’s plants, there are 60,065 tree species in the world. Using tree data gathered from its network of 500 member organizations, Botanical Gardens Conservation International (BGCI) compiled the tree list. This new data is crucial to identifying and protecting rare and endangered species.
  • The dogwood tree — the living symbol of the American spring — makes a comebackThe Washington Post
    Just a few decades ago, the dogwood tree was critically endangered due to a new disease. In recent years, however, the species has made a successful comeback. The dogwood tree lives on in the form of new varieties and hybrids developed to resist the disease that once brought the species to near extinction.
  • Polish law change unleashes ‘massacre’ of treesThe Guardian
    A new amendment to Polish environmental law has become a subject of controversy. Commonly known as “Szyszko’s law”, the amendment removes the obligation for private landowners to apply for permission to cut down trees, pay compensation or plant new trees, or even to inform local authorities that trees have been or will be removed.
  • Scottish charity hopes to boost numbers of rare treeBBC News
    A conservation charity in Scotland aims to grow wild populations of aspen trees, which are at risk because they rarely flower and collecting seeds for propagation is almost impossible. The group, Trees for Life, hopes to have created its own source of seeds by encouraging branches to flower under controlled conditions.

The post Forest Digest — Week of April 3, 2017 appeared first on American Forests.