The NC ADAPT Work Group is a coalition of leaders from the agriculture and forestry sectors, along with partners from the business, academic, research and government communities. The NC ADAPT Work Group’s initial mission was to explore the threats and impacts of increasingly extreme and erratic weather events and changing climatic conditions on North Carolina’s agriculture and forestry sectors to determine if these sectors are adequately prepared for what scientists are projecting. The NC ADAPT Work Group concluded that weather variability is a threat to agriculture and forestry in North Carolina, preparation is needed, and the state would benefit from the development of a comprehensive adaptive management strategy. The NC ADAPT Work Group’s findings and roadmap for constructing an adaptive management plan are outlined in the June 2015 report, Keeping North Carolina’s Farms and Forests Vibrant and Resilient: An Adaptive Management Planning Strategy.
Author: Site Owner
Northeast Regional Climate Hub Pilots Discussion Groups for Climate Adaptation

Sign up to become part of a new discussion forum on climate change and agriculture in the northeast, hosted by the USDA Northeast Climate Hub and the Climate Learning Network. In response to stakeholder demand, we created six forums focused on crops, livestock, forestry, aquaculture, fruit or specialty products. These email distribution lists are designed for you and your colleagues to share information and learn about innovative adaptations in this region. These lists are a professionally moderated forum for question/answer-style dialogue among peers. Learn about the climate impacts on agriculture and the successful adaptations that keep farms productive.
Northern Institute for Applied Climate Science Expands Adaptation Workbook
NIACS created the Adaptation Workbook as an online, interactive version of the decision-making process published in Forest Adaptation Resources. NIACS has recently updated the site with many new improvements. Most significantly, the Adaptation Workbook now supports urban forestry and agriculture projects, in addition to regular forestry projects. The goal of the project is to help a wider variety of landowners and land managers to use the site, which helps people connect their land management goals to practical, ready-to-use information on climate change impacts and adaptation actions. Visit the Adaptation Workbook and give it a try.
Unforced Variations: March 2017
This month’s open thread.
In Search of 141 Million Acres of Urban Forest
padding-left: px !important;
padding-right: px !important;
}
By Ian Leahy, Director of Urban Forest Programs
“Urban forests provide critical social and environmental benefits for 83 percent of the US population living among 136 million acres of urban forest land.”– Ten-Year Urban Forestry Action Plan

Credit: Chuck Fazio, our Artist-in-Residence
136 million acres. This number has been common boilerplate in press releases and reports in our field for quite a few years now. It is generally trotted out to subtly draw favorable comparison with the 193 million acres of national forests that are managed under much larger federal budgets. For better or worse, that official number may soon be creeping a little closer to the scale of national forests.
When a landscape is converted from one dominated by natural systems to one teeming with many small landowners, businesses, multi-lane roads and dense population, the way in which that land must be managed fundamentally changes. That’s where urban forestry comes in. Knowing what scale we’re dealing with is an important factor.
U.S. Forest Service scientist and American Forests’ science advisory board member David Nowak has submitted for peer review an updated estimate of 141 million acres nationwide. That number will, of course, continue to grow over time as the Regional Plan Association projects 90 percent of Americans will be living in urbanized areas by 2050.
But, what does this 141 million acres comprise?
For starters, it’s important to realize that only 68 million of those acres exist in actual urbanized areas or clusters. As defined by the U.S. Census Bureau (2013), an urbanized area has a population of at least 50,000 people. Urban clusters are more flexible, possessing a population between 2,500 and 50,000 people.
The remaining 73 million acres fall into the “community” part of “urban and community forestry.” This includes anywhere that is an incorporated or designated place. By overlapping measurements mixing population density with geopolitical delineations, we capture the cities, suburbs, exurbs and small towns where 83 percent of Americans live.
Once an area falls within this 141 million acres, urban forestry professionals and conservation planners often kick into action, seeking to develop an interconnected system of green infrastructure at different scales that can mimic, as closely as possible, the natural functions that have been lost. Or, in arid climates where forests are not a natural occurrence, urban forests are created out of nothing to serve a population now living in that landscape and needing the services a robust tree canopy can provide. This was the case in Denver, which claims an almost entirely manmade urban forest.
At the smallest scale, highly-engineered bioretention installations in sidewalks and streets serve as a last-chance filter before water floods the underground storm sewer lines. With slightly more open space, street trees, yard trees, gardens and landscaped boulevards can take root. Taken together, they serve as a front line defense against particulate matter and management of both water quality and quantity. These components of the urban forest integrated into residents’ daily life also provides the most tangible interaction many people have with nature on a daily basis, generating higher rates of social, mental health and economic benefits.
Green spaces, particularly interconnected ones, such as urban parks, river and coastal corridors, greenways, shelter belts of trees and working trees absorbing toxins from abandoned industrial lands, begin to mimic nature without intervention, providing the added benefit of easily-accessed recreational, economic, critical infrastructure protection and other open space benefits.
Lastly, it is the large nature preserves which have the potential to impact air quality, water quality, wildlife viability and quality of life throughout a region. These landscape-scale assets provide resilience to climate change and storm surges, protect drinking water sources and provide the types of large-scale recreational opportunities that often attract people to live in a community.
Integrated together, these different scales of green infrastructure each play a critical role in building livable, sustainable built environments from small towns to big cities.
The post In Search of 141 Million Acres of Urban Forest appeared first on American Forests.
The true meaning of numbers
Gavin has already discussed John Christy’s misleading graph earlier in 2016, however, since the end of 2016, there has been a surge in interest in this graph in Norway amongst people who try to diminish the role of anthropogenic global warming.
I think this graph is warranted some extra comments in addition to Gavin’s points because it is flawed on more counts beyond those that he has already discussed. In fact, those using this graph to judge climate models reveal an elementary lack of understanding of climate data.

Fig. 1. Example of Christy’s flawed evaluation taken from Comparing models to the satellite datasets.
Different types of numbers
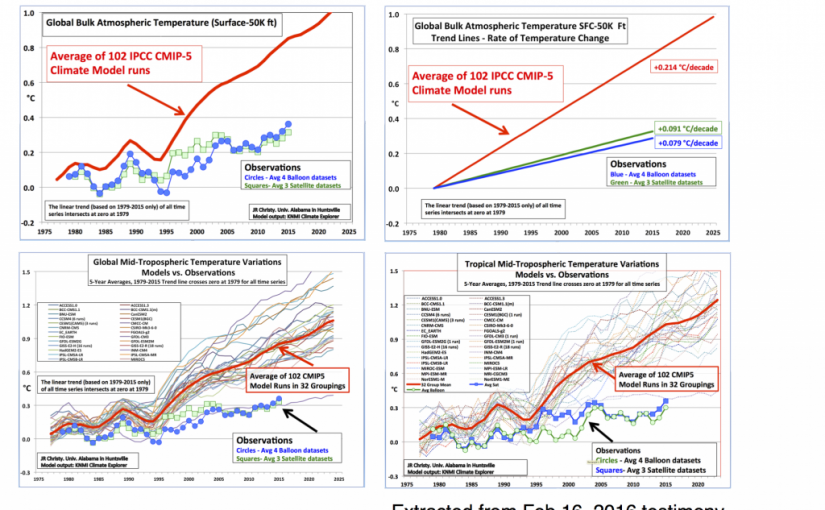
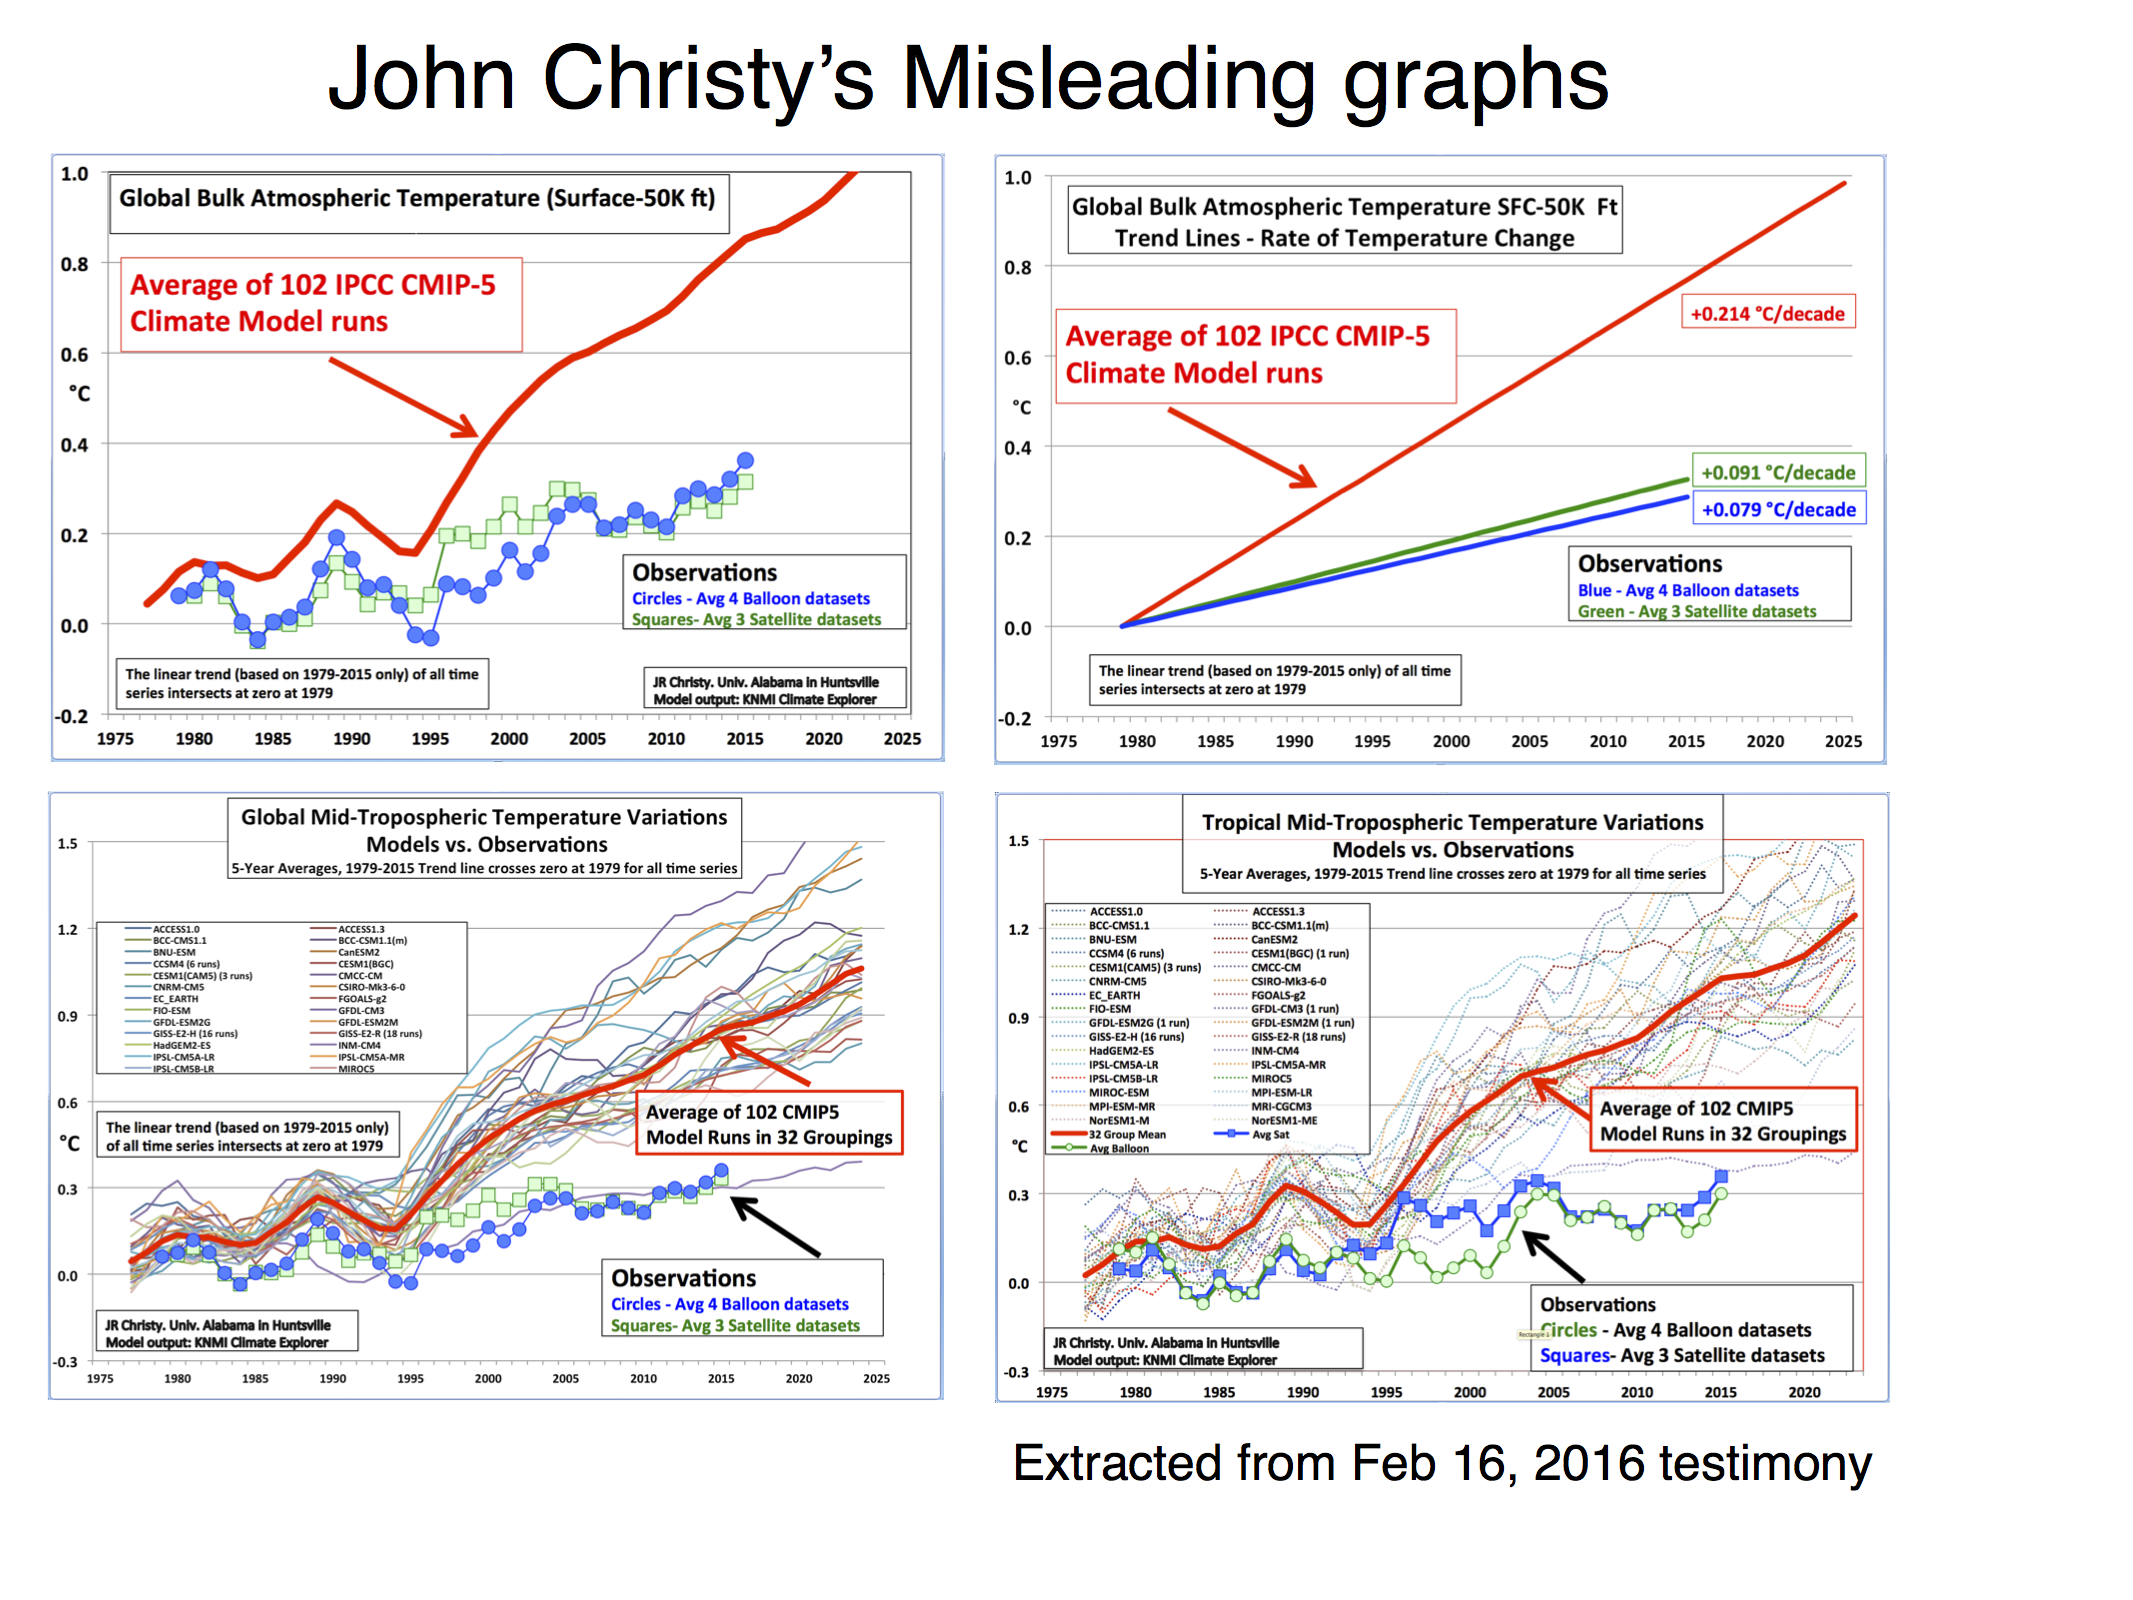
The upper left panel in Fig. 1 shows that Christy compared the average of 102 climate model simulations with temperature from satellite measurements (average of three different analyses) and weather balloons (average of two analyses). This is a flawed comparison because it compares a statistical parameter with a variable.
A parameter, such as the mean (also referred to as the ‘average’) and the standard deviation, describe the statistical distribution of a given variable. However, such parameters are not equivalent to the variable they describe.
The comparison between the average of model runs and observations is surprising, because it is clearly incorrect from elementary statistics (This is similar statistics-confusion as the flaw found in the Douglass et al. (2007)).
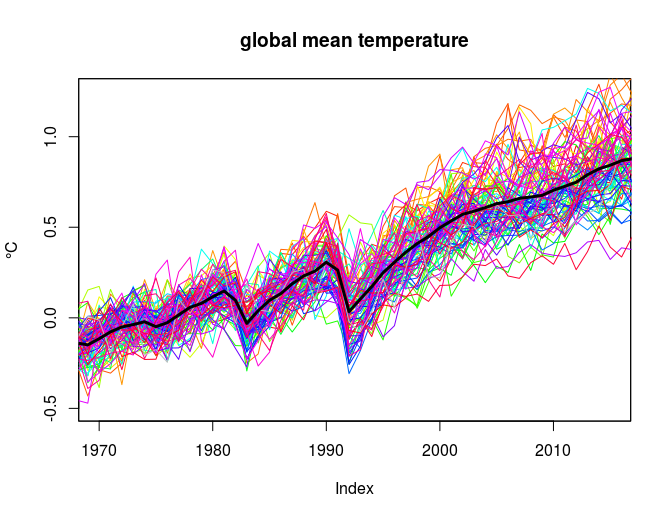
I can illustrate this with an example: Fig. 2 shows 108 different model simulations of the global mean temperature (from the CMIP5 experiment). The thick black line shows the average of all the model runs (the ‘multi-model ensemble’).

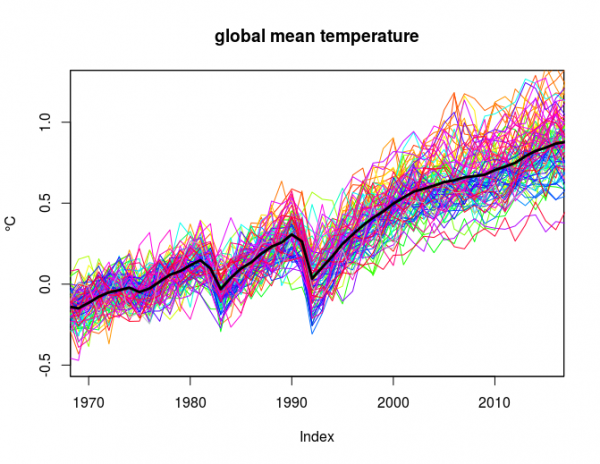
Fig. 2. Global mean temperature from ensemble simulations (CMIP5) and the NCEP/NCAR reanalysis 1 (baseline: 1961-90). (Figure source code)
None of the individual runs (coloured thin curves) match the mean (thick black curve), and if I were to use the same logic as Christy, I could incorrectly claim that the average is inconsistent with the individual runs because of their different characters. But the average is based on all these individual runs. Hence, this type of logic is obviously flawed.
To be fair, the observations shown in Cristy’s graph were also based on averages, although of a small set of analyses. This does not improve the case because all the satellite data are based on the same measurements and only differ in terms of synthesis and choices made in the analyses (they are highly correlated, as we will see later on).
By the way, one of the curves shown in Fig. 2 is observations. Can you see which? Eyeballing such curves, however, is not the proper way to compare different data, and there are numerous statistical tests to do so properly.
Different physical aspects
Christy compared temperatures estimated for the troposphere (satellites and balloons) with near-surface temperature computed by global climate models. This is a fact because the data portal where he obtained the model results was the KNMI ClimateExplorer. ClimateExplorer does not hold upper air temperature (I checked this with Geert Jan van der Oldenborgh).
A proper comparison between the satellite temperature and the model results needs to estimate a weighted average of the temperature over the troposphere and lower stratosphere with an appropriate altitude-dependent weighting. The difference between the near-surface and tropospheric temperature matters as the stratosphere has cooled in contrast to the warming surface.
Temperature from satellites are also model results
It is fair to compare the satellite record with model results to explore uncertainties, but the satellite data is not the ground truth and cannot be used to invalidate the models. The microwave sounding unit (MSU), the instrument used to measure the temperature, measures light in certain wavelength bands emitted by oxygen molecules.
An algorithm is then used to compute the air temperature consistent with the measured irradiance. This algorithm is a model based on the same physics as the models which predict that higher concentrations of CO2 result in higher surface temperatures.
I wonder if Christy sees the irony in his use of satellite temperatures to dispute the effect of CO2 on the global mean temperature.
It is nevertheless reassuring to see a good match between the balloon and satellite data, which suggests that the representation of the physics in both the satellite retrieval algorithm and the climate models are more or less correct.
How to compare the models with observations
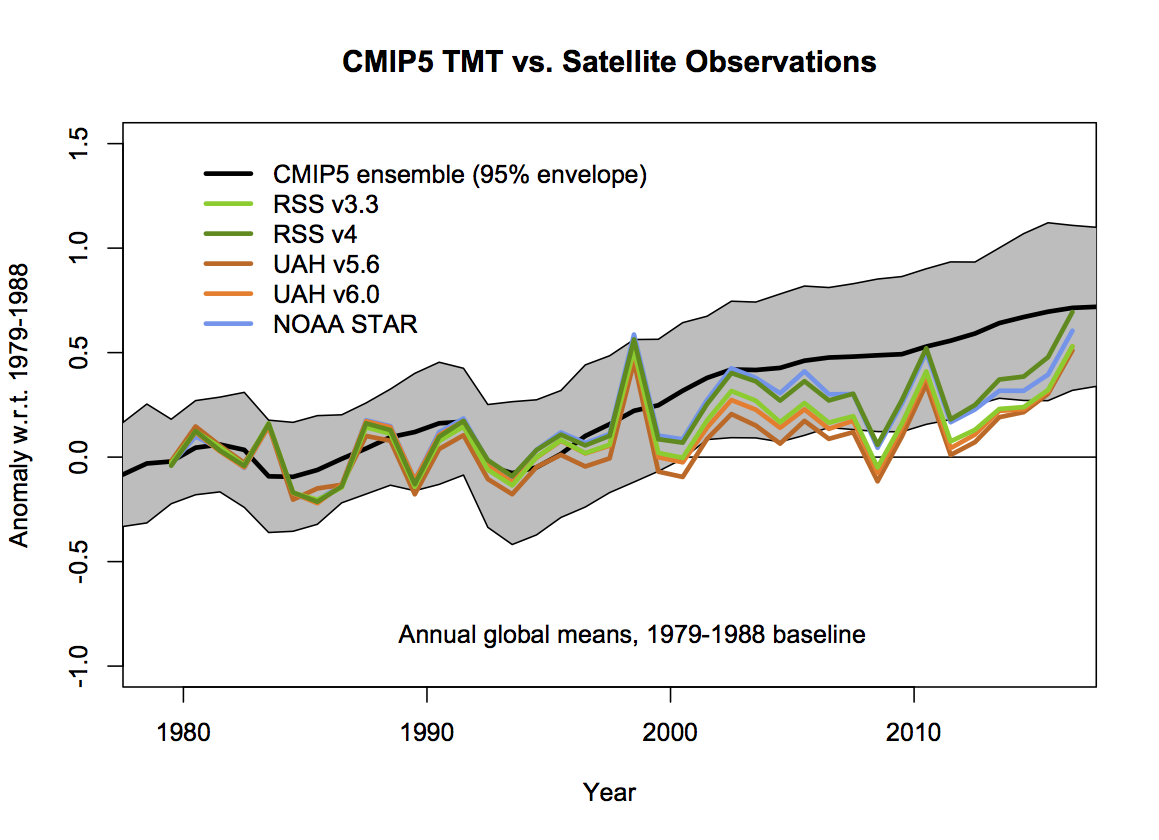
The two graphs (courtesy of Gavin) below show comparisons between tropospheric mean temperatures (TMT) that are comparable to the satellite data and include confidence interval for the ensemble rather than just the ensemble mean. This type of comparisons is more consistent with standard statistical tests such as the students t-test.
The graphs also show several satellite-based analyses: the Remote Sensing Systems (RSS; different versions), University of Alabama in Huntsville (UAH; Different versions), and NOAA (STAR). All these curves are so similar (highly correlated) that taking the average doesn’t make much difference.

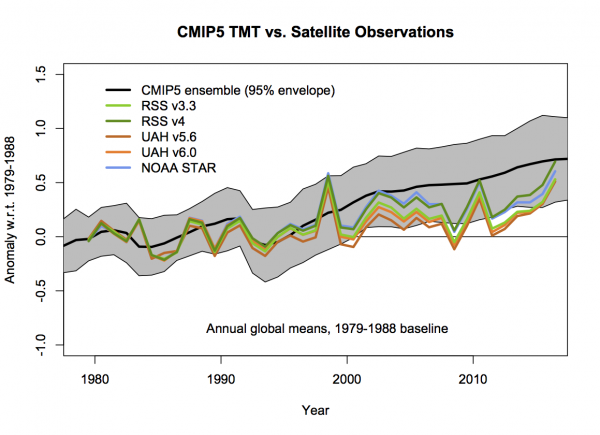
Fig. 3. Comparison between the evolution of the global mean tropospheric temperature (TMT). From Gavin.
According to Fig. 3, the tropospheric temperature simulated by the global climate models (from the CMIP5 experiment) increased slightly faster than the temperatures derived from the satellite measurements between 2000 and 2015, but they were not very different. The RSS temperatures gave the closest match with the global climate models.

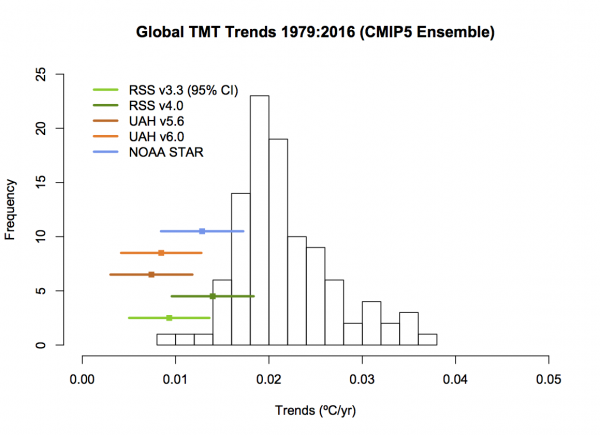
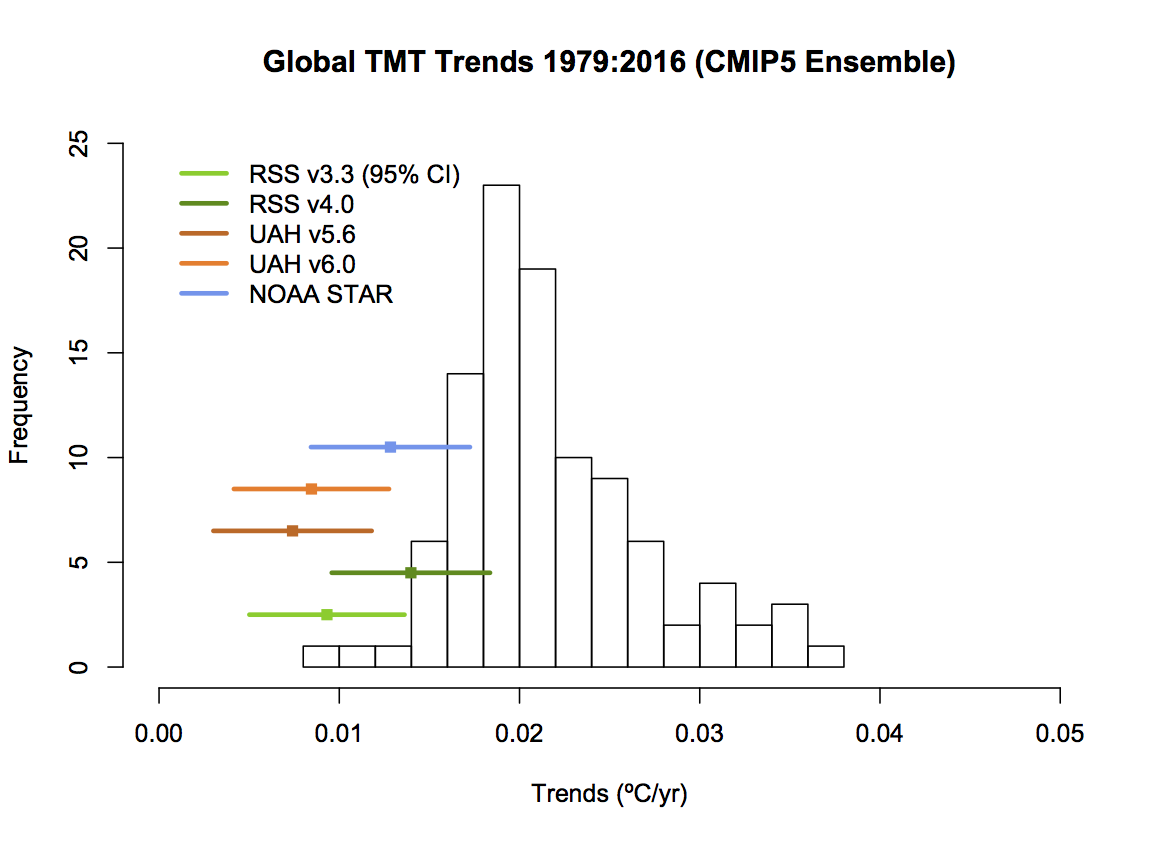
Fig. 4. Comparison of global mean tropospheric temperature trends where the satellite estimates are shown with confidence intervals. Trends for each model run also have similar error bars (not shown), but the trend statistics for the ensemble is presented through a histogram. From Gavin.
Fig. 4 shows a trend analysis for the 1979-2016 interval where the satellite-based temperature trends are shown with appropriate error bars. The trends from the satellite analyses and the model results overlap if the confidence limits are taken into consideration.
The story behind the upper tropospheric warming
The biggest weight of the troposphere temperature trends come from the tropics because it accounts for the largest volume (half of the Earth’s surface area lies between 30°S and 30°N due to its geometric shape), and they are therefore sensitive to conditions around the equator. This is also where large-scale convection takes place that produce bands of high clouds (the Inter-Tropical Convergence Zone – ITCZ).
Cloud formation through convection and condensation is associated with release of latent heat and influences the temperatures (e.g. Vecchi et al., 2006). It is part of the hydrological cycle, and a slow change in the atmospheric overturning, moisture and circulation patterns is expected to have a bearing on the global tropospheric temperature trend estimates.
This means that the picture is complex when it comes to the global tropospheric temperature trends because many physical processes have an influence that take place on a wide range of spatial scales.
Hard evidence of misrepresentation
Despite the complicated nature of tropospheric temperatures, it is an indisputable fact that Christy’s graph presents numbers with different meanings as if they were equivalent. It is really surprising to see such a basic misrepresentation in a testimony at the U.S. House Committee on Science, Space & Technology. One of the most elementary parts of science is to know what the numbers really represent and how they should be interpreted.
References
G.A. Vecchi, B.J. Soden, A.T. Wittenberg, I.M. Held, A. Leetmaa, and M.J. Harrison, “Weakening of tropical Pacific atmospheric circulation due to anthropogenic forcing”, Nature, vol. 441, pp. 73-76, 2006. http://dx.doi.org/10.1038/nature04744
A Forest a Day…
padding-left: px !important;
padding-right: px !important;
}
By Lindsay Seventko, American Forests

Credit: Vincent Brassinne via Flickr.
Most of us are well aware of what forests do for us — clean our air and water, store carbon and provide miles of beautiful landscapes to explore. But, one benefit that frequently goes under-appreciated is how forests help keep our minds and bodies healthy. While you may feel better after a walk through a forest, that isn’t due to just enjoying a hobby. Here are some of the ways that forests measurably benefit our minds and bodies to help keep us healthy and happy.
Humans have lived out in the natural environment for most of our long existence. Thus, the relatively recent switch (in the scheme of 5 million years!) to indoor living isn’t optimizing our bodies’ ability to thrive. When you get out in a forest, you’re truly revitalizing your mind and body.
Stronger Immune System
For starters, plants and trees in the forest give off phytoncides — airborne chemicals that the plants use to protect themselves from harmful bacteria and fungi.[1] When humans breathe them in, they increase a type of white blood cell known as NK. NK cells boost our immune systems and kill tumor cells, which may help prevent and fight certain types of cancer.[2]
Increased Relaxation
Furthermore, forests aid in relaxation, which lowers blood pressure and the stress hormones cortisol and adrenaline. While exercising in a forest brings maximum benefits, even looking at a forested view helps tremendously. Cortisol levels were more than 13 percent lower in people looking at a forested setting for 20 minutes, versus people looking at an urban setting. People also experienced a 2 percent lowering of blood pressure while walking in a forested area vs. an urban one. The parasympathetic nervous system (which is felt while relaxing), was enhanced by 56 percent while people viewed a forested area and by 102 percent by walking in a forested area. [3]
Why is this so important? Living with too much stress can be extremely damaging to your health. Over time, living with high stress levels can disrupt your body’s natural processes and cause the development of anxiety, depression, digestive problems, headaches, heart disease and several other issues.[4] Thus, spending time enjoying forests should be a priority not just as a hobby, but also as a method for staying healthy.
Creative Problem Solving
Beyond strictly physical benefits, spending time in forests makes a major difference in creativity and problem solving abilities. After a four-day backpacking trip, group members tested 50 percent higher on a creativity test. Researchers pointed out that the increased creativity may be due to lack of access to technology and not entirely due to the increased time in nature, but the combination’s impact on creative problem solving abilities are clear.[5]
Attention and Focus
Today’s use of technology and multitasking places high demands on attention, making it easily exhausted. Time spent outdoors replenishes our ability to pay attention and concentrate. For example, children who play outdoors in green areas see a reduction in ADHD symptoms compared to children who play the same games indoors.[6]
Forests are incredibly beneficial for countless reasons, but one area that is just beginning to be understood is how much forests physically benefit our minds and bodies. If you’re trying to maintain your health, need a creative solution to a problem or want to fully relax, head to the nearest forest and take in all the beauty and benefits of nature.
[1] “Immerse Yourself in a Forest for Better Health.” DEC NY: n.d.
[2] Wu J and Lanier LL. “Natural Killer Cells and Cancer.” Adv Cancer Res. 2003;90:127-56.
[3] Park, B. J., Tsunetsugu, Y., Kasetani, T., Kagawa, T., & Miyazaki, Y. (2010). The physiological effects of Shinrin-yoku (taking in the forest atmosphere or forest bathing): evidence from field experiments in 24 forests across Japan. Environmental Health and Preventive Medicine, 15(1), 18–26. http://doi.org/10.1007/s12199-009-0086-9
[4] “Chronic Stress Puts your Health at Risk.” Mayo Clinic: n.d.
[5] Atchley RA, Strayer DL, Atchley P (2012) Creativity in the Wild: Improving Creative Reasoning through Immersion in Natural Settings. PLoS ONE 7(12): e51474. doi:10.1371/journal.pone.0051474
[6] Kuo, F. E., & Faber Taylor, A. (2004). A Potential Natural Treatment for Attention-Deficit/Hyperactivity Disorder: Evidence From a National Study. American Journal of Public Health, 94(9), 1580–1586.
The post A Forest a Day… appeared first on American Forests.
Action Alert: Bureau of Land Management Planning Rule
padding-left: px !important;
padding-right: px !important;
}
**If you are having difficulty with accessing the letter, try temporarily disabling your ad/pop-up blocker plugin. Follow these instructions per your default browser.
jQuery(function() {
var myEventMethod =
window.addEventListener ? “addEventListener” : “attachEvent”;
var myEventListener = window[myEventMethod];
var myEventMessage =
myEventMethod == “attachEvent” ? “onmessage” : “message”;
myEventListener(myEventMessage, function (e) {
if (e.data === parseInt(e.data))
jQuery(‘#frame_id’).height(e.data);
}, false);
});
The post Action Alert: Bureau of Land Management Planning Rule appeared first on American Forests.
Drought Conditions at Lowest Point since Autumn 2010

U.S. Department of Agriculture (USDA) Forest Service (FS) Adaptive Management Services Enterprise Team (AMSET) Fire Behavior Assessment Team (FBAT) performs a site check during Cedar Fire operations in and near the Sequoia National Forest, Posey, CA.
Nationally, we are seeing extreme to exceptional (D3 to D4) drought conditions fall to their lowest point in more than 6 years. Nowhere is that change more dramatic than in California. The current (February 21, 2017) Drought Monitor for California notes the disappearance of D3/D4 from California. At the California drought’s peak from August-October 2014, that percentage was nearly 82 percent. As recently as early-December 2016, coverage of D3/D4 in California stood at 43 percent.
- The 5-year drought has caused the deaths of more than 100 million trees—mostly in the central and southern Sierra Nevada (https://www.usda.gov/wps/portal/usda/usdahome?contentid=2016/11/0246.xml).
- Row crop acreage in California declined from 4.27 million acres in 2010-12 to 3.23 million acres from 2014-16 (USDA-NASS).
- Economic impacts of the California drought are difficult to estimate, but researchers at the University of California estimate that the drought in 2016 alone resulted in resulted in $247 million loss of farm-gate revenues, and 1,815 full and part time jobs. When spillover effects to other parts of the economy are considered, total impacts are estimated to be 4,700 full and part time jobs and $600 million in sector output losses. Those costs were likely higher in 2014 and 2015 due to more severe drought conditions.
Data from the California Department of Water Resources indicates the snow that fell across the Sierra Nevada in January alone contained an average of two feet of liquid—more than 80 percent of the normal seasonal total (see figure below). Adding snow that accumulated from October-December 2016 and during the first three weeks of February, the Sierra Nevada is ensured of an above-average snowpack for the first time in six years when the traditional peak snowpack date arrives on April 1.

Daily Sierra Nevada Snowpack (Inches) vs. Normal chart.
While most decisions about water allocations are made at the state level, the abundance of precipitation during California’s wet season; the promise of abundant, snowmelt-driven spring and summer runoff; and an already dramatic increase in statewide reservoir storage all bode well for a general easing of water restrictions in the wake of the five-year drought and for agriculture in general, the largest user of California’s stored water.
California is the most productive agricultural state in the nation, with more than $47 billion in cash receipts and $14.5 billion in net farm income in 2015. It largest sectors include dairy (sales of about $6.3 billion), almonds (sales of more than $5.3 billion), and grapes (sales of nearly $5 billion). Crop insurance indemnities for California crops doubled in 2014 to about $380 million and nearly doubled again in 2015 to $622 million before falling back to $250 million in 2016. Pre-drought indemnities typically averaged around $115 million in the ten year period 2004-2013.
U.S. Agricultural Production Systems of the Future: What Research is Needed Now?

Windbreaks are plantings of trees, shrubs or both, that shelter crops, soil, animals, homes, and people from wind, snow, dust, or odors. These systems save energy and can cut home heating costs. Windbreaks also help net big gains in carbon storage, improve income by increasing crop yields, and protect livestock from heat and cold stress.
Depending on where you live in the United States, the first thing that likely comes to mind for agriculture production systems are the large fields of corn, soybeans, wheat or cotton seen growing each summer. But spend a few minutes looking at CropScape, a color-coded map that charts where almost a hundred different types of U.S. crops are grown currently, and you begin to appreciate the diversity and regionality of production systems. This map shows that although there are U.S. regions where crop production is dominated by a few commodity crops, there are others where U.S. farmers are growing a wide array of fruit, vegetables, and other “specialty” crops. Agricultural Atlas maps produced by USDA’s National Agricultural Statistics Service show similar diversity in livestock production, including land in pasture and range production.
The diversity of agricultural production systems across the United States presents wide-ranging opportunities for exciting new research and innovation. New scientific findings and new technology, for example robotic automation, artificial intelligence, vertical farming and gene editing, could all play a role in not only improving existing systems but in developing new systems and new products altogether. New and emerging agricultural products can generate exciting new niches for farmers who want to meet consumer demands for crops and livestock with improved nutritional or environmental benefits.
USDA needs to know how research can help U.S. farmers produce the agricultural products consumers desire while being both economically and environmentally sustainable long into the future. On March 2, USDA’s Office of the Chief Scientist is hosting a stakeholder listening session to identify opportunities, knowledge, and gaps in agricultural research, which will help us evaluate research priorities for enhancing U.S. agricultural production systems over the next 50 years. We’re particularly interested in discussing new technologies or knowledge that can improve agriculture in measurable ways. You can listen to this session live by computer (March 2, 2017 USDA Listening Session), or by phone [888-844-9904, code 8967180] and submit written comments up to a week after the listening session as listed in the Federal Registry. Please email Dr. Seth Murray at seth.murray@osec.usda.gov for additional instructions and information before submitting written comments.

Alley Cropping is a way to include both annual crops and perennial trees on the landscape, diversifying both economic opportunities and ecosystem services provision.
The success of sustainable agriculture practices does not just affect farmers. It is also vital for consumers whose everyday lives are improved by agricultural innovations supporting the production of a safe, abundant, and affordable food supply and protecting and enhance our natural resources–now and for the future.

Trees and perennial grasses can reduce runoff of nutrients and sediment, leading to cleaner water downstream. New scientific discoveries and technologies applied to agricultural research and development could result in new food and feed systems that provide increased economic opportunity and environmental stewardship.