USDA Publishes Guide to Help Corner Stores Sell Healthier Foods

A lady making purchases using her SNAP benefits

A lady making purchases using her SNAP benefits (food stamps).

We all hear the recommendations on healthier eating and the advice we get from experts on health. But eating healthy is not as easy as simply following everything we hear from doctors and nutritionists. Sometimes, access to healthier food choices is limited by one’s neighborhood. Other times, the food choices for fresher and more nutritious items are simply not financially attainable. And in yet other cases, the barriers to healthier food choices can be something as simple as knowing where to look in your local store.

That’s where the Food and Nutrition Service of the USDA comes in — trying to improve the availability of healthier items for those we serve, without sacrificing taste. FNS is the federal agency in charge of running the SNAP program. And there’s no reason why SNAP recipients have to bear an inferior supply of healthy foods.

FNS continues expanding its information to Spanish-speaking individuals benefiting from our public assistance programs. In addition to our What’s Cooking website that contains hundreds of Spanish recipes for healthy and budget conscious dishes, we recently published a new Healthy Corner Store Guide. The same document is available in English.

The purpose of the publication is to educate small business owners small store owners on how to improve access and sales of healthy products. The Healthy Corner Stores Guide provides strategies for marketing healthier product options, sourcing healthy food and beverages, and making changes to the way food and beverage items are displayed. For example, stores could display healthier items at eye-level, near checkout counters, or by entryways, so they are visible when customers first enter the store.

Corner stores are more prevalent in low income communities. Low-income areas have significantly more as many convenience stores than higher income areas. Hispanic youth are more likely to attend schools with convenience stores and snack stores nearby. That’s why our agency is trying to focus on ways to improve the selection of fruits and vegetables, among other healthy choices.  Corner stores tend to sell little fresh produce, whole grains, and low-fat dairy products. Proximity to convenience stores within a neighborhood is associated with higher rates of obesity and diabetes—diseases that disproportionately impact Latinos.

Given that Hispanics tend to make use of these types of stores, it’s our goal that those making purchases with their SNAP benefits are able to buy healthy foods for them and their families. We appreciate store owners who are taking the first steps in making this transformation a reality.

English version of the Spanish websites linked above:

Food and Nutrition Service

https://www.usda.gov/

https://www.fns.usda.gov/snap/supplemental-nutrition-assistance-program-snap

https://whatscooking.fns.usda.gov/

https://www.cdc.gov/Features/hispanichealth/

The underestimated danger of a breakdown of the Gulf Stream System

A new model simulation of the Gulf Stream System shows a breakdown of the gigantic overturning circulating in the Atlantic after a CO2 doubling.

A new study in Science Advances by Wei Liu and colleagues at the Scripps Institution of Oceanography in San Diego and the University of Wisconsin-Madison has important implications for the future stability of the overturning circulation in the Atlantic Ocean. They applied a correction to the freshwater fluxes in the Atlantic, in order to better reproduce the salt concentration of ocean waters there. This correction changes the overall salt budget for the Atlantic, also changing the stability of the model’s ocean circulation in future climate change. The Atlantic ocean circulation is relatively stable in the uncorrected model, only declining by about 20% in response to a CO2 doubling, but in the corrected model version it breaks down completely in the centuries following a CO2 doubling, with dramatic consequences for the climate of the Northern Hemisphere.

The potential instability of the Atlantic Meridional Overturning Circulation or AMOC – commonly known as the Gulf Stream System – has been a subject of research since the 1980s, when Wallace Broecker warned in an essay in Nature of Unpleasant Surprises in the Greenhouse. The reason for this was growing evidence of abrupt climate changes in the history of the Earth due to instability of Atlantic currents.

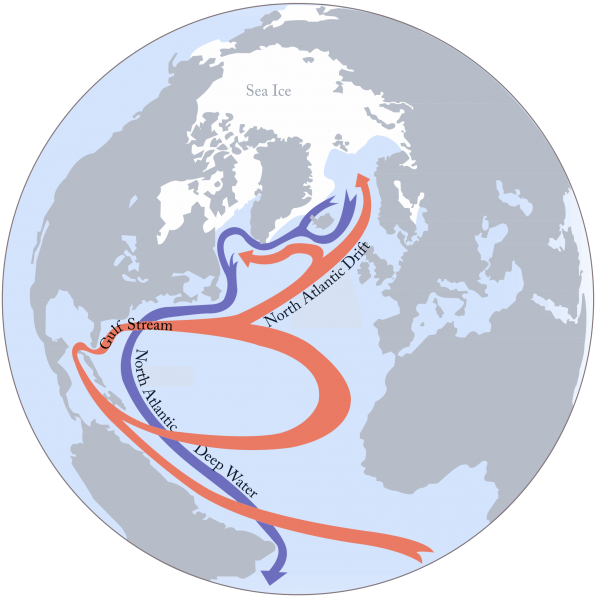
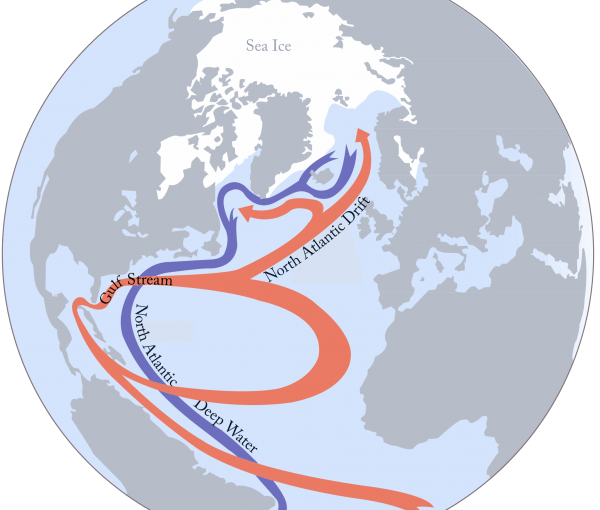
Fig. 1 Schematic of the Atlantic ocean circulation (simplified). In red the relatively warm surface flow is seen, in blue the cold deep water flow. The northward surface flow and southward deep flow together make up the Atlantic Meridional Overturning Circulation (AMOC), popularly dubbed Gulf Stream System. Image by S. Rahmstorf (Nature 1997), Creative Commons BY-SA 4.0. 

Why the AMOC has a tipping point

The basic physical mechanism of this instability was already described by Henry Stommel in 1961. The freshwater balance (precipitation minus evaporation), which determines the salt content, is central to this. Freshwater continually flows into the northern Atlantic through precipitation, rivers and ice-melting. But supply of salty waters from the south, through the Gulf Stream System, balances this. If however the current slows, there is less salt supply, and the surface ocean gets less salty. This fresher water is lighter than saltier water and therefore cannot sink into the depths so easily. Since this sinking – the so-called deep water formation – drives the Gulf Stream System, the current continues to weaken. There is a critical point when this becomes an unstoppable vicious circle. This is one of the classic tipping points in the climate system.

However, it’s still unclear where exactly this tipping point is. Most models show a significant slowdown in the Gulf Stream System by 20% to 50% in typical global warming scenarios up to the year 2100, but do not exceed the tipping point that would lead to its collapse. However, there is a large spread between different models – which is not surprising since the stability of the Atlantic flow depends on a subtle balance in the salinity and thus also in the freshwater budget, which is only inaccurately known. In addition, there have long been serious indications that the models are not only inaccurate, but perhaps all systematically biased towards an exceedingly stable AMOC. We discussed these papers in a review article in PNAS in 2009.

What makes the new study different?

According to lead author Wei Liu, the starting point of the new study was my paper from 1996 on the relationship between the freshwater balance and stability of the flow. Back then I showed how to determine the stability of the AMOC from an analysis of the freshwater transport in the Atlantic at 30° south. The decisive factor is whether the AMOC brings freshwater into the Atlantic basin or whether it exports it (in the latter case, working to increase salinity in the Atlantic). My article ended with the suggestion to clarify this from observational data. That was later done by colleagues from Holland (Weijer et al. 1999). Several studies followed which performed this diagnosis for different climate models (e.g., Pardaens et al. 2003, de Vries and Weber 2005Dijkstra 2007, Drijfhout et al. 2010, Hawkins et al. 2011). According to the observational data, the AMOC is exporting freshwater, which is why freshwater will accumulate in the Atlantic when the AMOC breaks down. That is precisely the instability described by Stommel 1961 and Broecker 1987. In the models, on the other hand, the AMOC in most cases imports freshwater, so the flow is fundamentally stable there. The differences in AMOC stability between different models cannot be understood without the fundamental criterion of whether the AMOC imports or exports freshwater, and by what amount. Liu et al. 2014 have identified a known common bias in all coupled climate GCMs without flux adjustments, the “tropical bias”, which makes them import freshwater in contrast to what observations show for the real ocean. A model bias towards stability is also consistent with the fact that most models underestimate the cooling trend observed in the subpolar Atlantic, which is indicative of an ongoing significant AMOC weakening, as we have argued (Rahmstorf et al. 2015).

The new study attempts to correct this model deficit by modifying the freshwater exchange at the sea surface in a model by using a so-called flux correction (which also involves the heat exchange, but this should be secondary). As a result, the salinity distribution in the ocean of the model for today’s climate is in better agreement with that of the real ocean. This is an important criterion: while precipitation and evaporation over the oceans are difficult to measure and therefore only very imprecisely known, we have detailed and precise information about the salinity distribution from ship measurements. Apart from the improved salinity distribution, this correction has no significant influence on the model climate for the present.

And now the result …

With both model variants – with and without the subtle correction of the salinity distribution – an experiment was performed in which the amount of CO2 in the air was doubled. The reaction of the Atlantic circulation is shown in the following graph. Without correction, the AMOC once again proves to be very stable against the massive disturbance. With the correction, in contrast, the flow breaks down in the course of about 300 years. It has lost a third of its strength after 100 years.


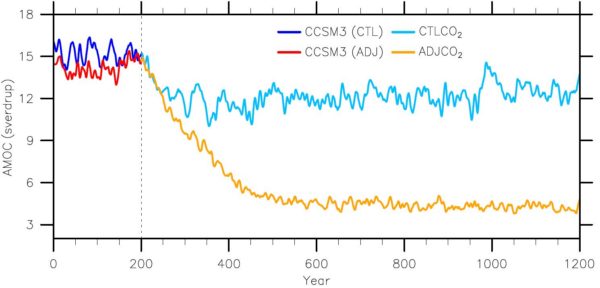
Fig. 2 Time series of the Atlantic flow (AMOC) in the two model variants: without correction (blue) and with correction (orange). In model year 201, the CO2 concentration in the model is doubled and then left at this level. Source: Liu et al., Science Advances 2016.

As expected, the breakdown of the heat-bringing Gulf Stream System leads to a cooling in the northern Atlantic, as shown in Figure 3. Land areas are also affected: besides Greenland and Iceland mainly Great Britain and Scandinavia.


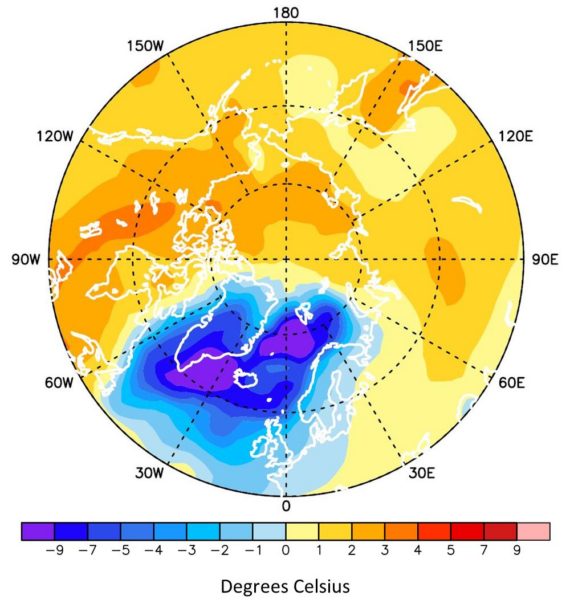
Fig. 3 Temperature change in the winter months (DJF), 300 years after CO2 doubling in the experiment. Due to the almost completely extinct Atlantic flow, the northern Atlantic region has cooled significantly. Source: Wei Liu, with permission.

This new study is certainly not the last word on this important question. Compared to the measured data the correction appears to be somewhat too strong – the adjusted model version might therefore be too unstable. As computing time is scarce and expensive, the CO2 concentration in the experiments was abruptly doubled, rather than gradually ramped up in a more realistic emission scenario. The experiment was carried out with only one climate model; for robust conclusions, one usually waits until a series of models shows consistent results. (However, consistent with the new results two earlier climate GCMs and a number of simpler models have shown an AMOC that exports freshwater and is bistable, i.e. could potentially pass a tipping point and break down, as discussed by Liu et al. 2014.)

Also, no meltwater influence from the dwindling continental ice on Greenland was taken into account, which could additionally weaken the flow. On this topic, only three weeks ago a new study was published (Bakker et al. 2016) comparing future warming scenarios, once with and once without consideration of the influx of Greenland meltwater. (An emulator was used for this study; that is a highly simplified computer model that reproduces the results of complex circulation models in a time-saving way, so that many experiments can be performed with it.) With unmitigated emissions (RCP8.5 scenario), the Gulf Stream System weakens on average by 37% by the year 2300 without Greenland melt. With Greenland meltwater this doubles to 74%. And a few months ago, a study with a high-resolution ocean model appeared, suggesting that the meltwater from Greenland is likely to weaken the AMOC considerably within a few decades (Böning et al. 2016 – as we reported).

There are, therefore, two reasons why thus far we could have underestimated the risk of a breakdown of the Gulf Stream System. First, climate models probably have a systematic bias towards stable flow. Secondly, most of them do not take into account the melting ice of Greenland. As the new studies show, each of these factors alone can lead to a much stronger weakening of the Gulf Stream system. We now need to study how these two factors work together. I hope these worrying new results will encourage as many other research groups as possible to pursue this question with their own models!

Weblinks

Washington Post: Scientists say the global ocean circulation may be more vulnerable to shutdown than we thought

Video lecture on the Gulf Stream System

More on the Gulf Stream System slowdown at RealClimate

Q & A about the Gulf Stream System slowdown and the Atlantic ‘cold blob’

AMOC slowdown: connecting the dots

What’s going on in the North Atlantic?

A hypothesis about the cold winter in eastern North America

Blizzard Jonas and the slowdown of the Gulf Stream System

References


  1. W.S. Broecker, “Unpleasant surprises in the greenhouse?”, Nature, vol. 328, pp. 123-126, 1987. http://dx.doi.org/10.1038/328123a0


  2. H. STOMMEL, “Thermohaline Convection with Two Stable Regimes of Flow”, Tellus, vol. 13, pp. 224-230, 1961. http://dx.doi.org/10.1111/j.2153-3490.1961.tb00079.x


  3. T.M. Lenton, H. Held, E. Kriegler, J.W. Hall, W. Lucht, S. Rahmstorf, and H.J. Schellnhuber, “Tipping elements in the Earth’s climate system”, Proceedings of the National Academy of Sciences, vol. 105, pp. 1786-1793, 2008. http://dx.doi.org/10.1073/pnas.0705414105


  4. M. Hofmann, and S. Rahmstorf, “On the stability of the Atlantic meridional overturning circulation”, Proceedings of the National Academy of Sciences, vol. 106, pp. 20584-20589, 2009. http://dx.doi.org/10.1073/pnas.0909146106


  5. S. Rahmstorf, “On the freshwater forcing and transport of the Atlantic thermohaline circulation”, Climate Dynamics, vol. 12, pp. 799-811, 1996. http://dx.doi.org/10.1007/s003820050144


  6. W. Weijer, W.P.M. de Ruijter, H.A. Dijkstra, and P.J. van Leeuwen, “Impact of Interbasin Exchange on the Atlantic Overturning Circulation”, Journal of Physical Oceanography, vol. 29, pp. 2266-2284, 1999. <a href="http://dx.doi.org/10.1175/1520-0485(1999)0292.0.CO;2″>http://dx.doi.org/10.1175/1520-0485(1999)0292.0.CO;2


  7. A.K. Pardaens, H.T. Banks, J.M. Gregory, and P.R. Rowntree, “Freshwater transports in HadCM3”, Climate Dynamics, vol. 21, pp. 177-195, 2003. http://dx.doi.org/10.1007/s00382-003-0324-6


  8. P. de Vries, “The Atlantic freshwater budget as a diagnostic for the existence of a stable shut down of the meridional overturning circulation”, Geophysical Research Letters, vol. 32, 2005. http://dx.doi.org/10.1029/2004GL021450


  9. H.A. Dijkstra, “Characterization of the multiple equilibria regime in a global ocean model”, Tellus A, 2007. http://dx.doi.org/10.3402/tellusa.v59i5.15173


  10. S.S. Drijfhout, S.L. Weber, and E. van der Swaluw, “The stability of the MOC as diagnosed from model projections for pre-industrial, present and future climates”, Climate Dynamics, vol. 37, pp. 1575-1586, 2010. http://dx.doi.org/10.1007/s00382-010-0930-z


  11. E. Hawkins, R.S. Smith, L.C. Allison, J.M. Gregory, T.J. Woollings, H. Pohlmann, and B. de Cuevas, “Bistability of the Atlantic overturning circulation in a global climate model and links to ocean freshwater transport”, Geophysical Research Letters, vol. 38, pp. n/a-n/a, 2011. http://dx.doi.org/10.1029/2011GL047208


  12. W. Liu, Z. Liu, and E.C. Brady, “Why is the AMOC Monostable in Coupled General Circulation Models?”, Journal of Climate, vol. 27, pp. 2427-2443, 2014. http://dx.doi.org/10.1175/JCLI-D-13-00264.1


  13. S. Rahmstorf, J.E. Box, G. Feulner, M.E. Mann, A. Robinson, S. Rutherford, and E.J. Schaffernicht, “Exceptional twentieth-century slowdown in Atlantic Ocean overturning circulation”, Nature Climate Change, vol. 5, pp. 475-480, 2015. http://dx.doi.org/10.1038/NCLIMATE2554


  14. P. Bakker, A. Schmittner, J.T.M. Lenaerts, A. Abe-Ouchi, D. Bi, M.R. van den Broeke, W. Chan, A. Hu, R.L. Beadling, S.J. Marsland, S.H. Mernild, O.A. Saenko, D. Swingedouw, A. Sullivan, and J. Yin, “Fate of the Atlantic Meridional Overturning Circulation: Strong decline under continued warming and Greenland melting”, Geophysical Research Letters, 2016. http://dx.doi.org/10.1002/2016GL070457


  15. C.W. Böning, E. Behrens, A. Biastoch, K. Getzlaff, and J.L. Bamber, “Emerging impact of Greenland meltwater on deepwater formation in the North Atlantic Ocean”, Nature Geoscience, vol. 9, pp. 523-527, 2016. http://dx.doi.org/10.1038/ngeo2740

Connecting Health, Faith and Agriculture: How One Community is Using Agriculture to Support Community Health

A student from Conetoe Family Life Center presenting

A student from Conetoe Family Life Center discusses her favorite aspect of the program. 17 students from CFLC's program gave a presentation to USDA leadership and staff about their programs.

In the rural community of Conetoe, North Carolina, residents are taking aim at the lack of access to healthy and nutritious food and its youth are leading the charge. In the predominately African American town, more than 60 youth participants of Conetoe Family Life Center (CFLC) have a direct role in the health and welfare of their community.

Conetoe Family Life Center was established in 2007 by Reverend Richard Joyner, a 2010 CNN Hero, to address persistent poverty and lack of access to healthy foods for the predominantly African American rural town of Conetoe, North Carolina.  As a result of CFLC’s efforts, the community has seen a dramatic decrease in negative health determinants.

CFLC’s initial farm started as a 2-acre garden and has now blossomed into a 25-acre community farm. Youth participants, ages 4 to 18, get homework help in the free afterschool and summer day camp programs, while actively engaging in the planting, harvesting, and selling, of their produce and honey.

On December 16, 2016, USDA Center for Faith-Based and Neighborhood Partnerships hosted 27 youth and chaperones from Conetoe Family Life Center (CFLC) at the USDA complex in Washington, D.C. The purpose of this visit was to highlight the many educational and career opportunities available through USDA and provide a forum for CFLC youth to engage with USDA leadership and share the successes they have experienced through the program.

A key component of the visit included a presentation for the staff and youth of CFLC. The presentation included remarks from Audrey Rowe, Administrator of Food and Nutrition Service and a program overview by the 17 students from CFLC’s Bee Program, who ranged from 10 – 15 years old.

The Conetoe Family Life Center “bee bus” serves as a key element of CFLC’s youth development programs. The recycled school bus-turned-honey bee-hive helps ensure better crop cultivation while providing the students with leadership and entrepreneurial skills. The children have managed the project from the start – learning the science behind building hives, painting the bus to attract the bees back, and harvesting honey to sell at Farmers Markets around the region with proceeds going to education scholarships.

After their presentation, students engaged with USDA leadership and staff on a variety of issues and topics including, 1890’s National Scholars Program, ARS – Bee Research Lab, and NRCS Earth Team Volunteers and Pathways Internships. Each topic area is designed to expose CFLC youth with opportunities for further engagement with USDA including future careers.

Additionally, students participated in a comprehensive USDA complex tour that includes the Creative Media and Broadcast Center, Secretary’s Office and People’s Garden Apiary. Additionally students received take-home educational materials including hand-outs and fun giveaways.

Conetoe Family Life Center has been the recipient of various USDA support, including GroupGAP certification, NRCS technical assistance and Socially Disadvantaged Farmers and Ranchers and Veteran Farmers and Ranchers Program.

A tour of the Whitten Patio with students and chaperones of Conetoe Family Life Center

Torey Powell with USDA Center for Faith-Based and Neighborhood Partnerships gives a tour of the Whitten Patio to students and chaperones of Conetoe Family Life Center. Ed Murtaugh and Meaghan McDonnell from USDA Office of Operations helped guide the students through USDA's current sustainability efforts.

Kick off a Healthy New Year with SuperTracker!

The SuperTracker My Messages web page

Sign up to have SuperTracker notifications sent to your email address!

Do your New Year’s resolutions include a healthier eating style and more physical activity? Whether you find inspiration from a personal challenge, or by competing with others in a group, we have the tools to keep you motivated and help you reach your goals with updated features in SuperTracker, the food and physical tracking tool from the USDA Center for Nutrition Policy and Promotion (CNPP).

Healthier Together: MyPlate New Year’s Challenge

Join us for the MyPlate New Year’s Challenge on SuperTracker during the month of January! All month, MyPlate will be challenging participants to focus on the MyPlate food groups and physical activity. Each week, a new food group will be added to the Challenge. Participants will use the Quick Tracker to log their foods and physical activities, and winners will be announced every Friday.

Here’s an overview of each week of the Challenge, to get you excited for what’s to come!

  • Week One: Dairy and Physical Activity
  • Week Two: Fruits, Dairy, and Physical Activity
  • Week Three: Vegetables, Fruits, Dairy, and Physical Activity
  • Week Four: Protein Foods, Vegetables, Fruit, Dairy, and Physical Activity
  • Week Five: Grains, Protein Foods, Vegetables, Fruit, Dairy, and Physical Activity

Visit the Join Group page and enter the access code “MYPLATE” to join in the fun today! Members can link their email address in the SuperTracker Message Center to receive tips and encouragement along the way.

Whether you’re just starting on the path to a healthier lifestyle, or need some motivation to continue your efforts, SuperTracker has the tools and resources you need to make those resolutions stick! Visit SuperTracker.usda.gov to check out the MyPlate New Year’s Challenge. Have a happy and healthy New Year!

ERS Showcases the Best of Its Popular “Charts of Note” Series

The top “Editors’ Pick” among ERS' Charts of Note

This is the top “Editors’ Pick” among the Charts of Note – an USDA Economic Research Service series. ERS editors selected the 10 best from 244 graphs and maps posted in 2016. Charts are provided daily on the web–and via email by free subscription.

Pictures may be worth a thousand words, but they can also help put numbers into a clearer perspective.

That‘s why USDA’s Economic Research Service (ERS) each day presents a graph or map with brief accompanying text that tells a visual mini-story about food, farming or rural America. Delivered to PCs, smartphones and tablets via email as well as being posted on our website, these “Charts of Note” provide daily snapshots of ERS research and findings. They cover facts and data that are timely, informative and sometimes surprising.

If you follow the ERS Charts of Note series on our website, you would know, for example that:

Among dairy products consumed by Americans in 2014 (cup-equivalents), cheese accounted for the largest share;

Ten percent of all land in farms is expected to be transferred in the period 2015-19; and

Three post-farm industry groups – foodservice, retail trade and processing – make up over 60 percent of the retail food dollar.

Charts of Note are often used by journalists to generate stories, by policy makers and researchers to support their work, and by anyone with an interest the food, farm and rural economic sectors. They’re designed to be easily shared, repurposed and reproduced by media outlets and other users.

In each of the last few years, the editors at ERS have selected a ranked list of the “10 best” Charts of Note for the past year. The 10 are those considered worthy of a second look because of their effectiveness in providing context to the year’s headlines or presenting key insights from our agency’s research. The 10 best Charts of Note in 2016, selected from 244 posted during the year, appear in a new chart gallery on the ERS website.

This year’s top 10 cover a range of topics including agricultural trade, farmland ownership, farm productivity, farm income, food consumption and food insecurity. The top-ranked chart (above) illustrates that emerging economies (e.g., China, Mexico and Brazil) are accounting for most of the growth in U.S. agricultural exports.

I invite you to view Charts of Note on our website. Or, you can make a New Year’s resolution to sign up for a free subscription to Charts of Note and receive them daily via email.

Winter Snow, Your Water and Trees: It’s More Complicated Than You Think

January 4th, 2017|Tags: , , |0 Comments

.fusion-fullwidth-1 {
padding-left: px !important;
padding-right: px !important;
}

By Doyle Irvin, American Forests

Snowpack

Credit: Chuck Fazio, our Artist-in-Residence.

There is an intimate relationship between wintry forests and the water cycle, and it deserves a little digging into. So, let’s take a look at the interworkings of snowpack — how forests affect it in different areas, some current debates about forest management practices and what the potential consequences may be for wildlife.

It’s fairly common knowledge that forested areas promote snowpack retention. Snow melts in the sun; trees provide shade. What’s less commonly talked about, and certainly surprised yours truly, is that the opposite is true in some climates — open fields were retaining snowpack for longer than forested areas. Researchers at the University of Washington were perplexed by this, and developed a study to attempt to answer why. Their study asserts that “this occurs because the dominant effect of forest cover shifts from slowing snowmelt by shading the snow and blocking the wind to accelerating snowmelt from increasing longwave radiation.”

Getting into the technicalities of short- and longwave radiation is beyond the scope of this post, but at its most basic form shortwave radiation is heat from the sun, and longwave radiation is heat from the Earth. The study found that winter snowmelt occurs more quickly under tree cover in areas where the mean temperatures are already above freezing — for example, warm Mediterranean climates like coastal areas in the Pacific Northwest. Essentially, trees radiate a little heat (they are less reflective than snow, absorbing more light), and it makes the difference in places already close to the melting point.

Do these findings change the current practice of planting trees to protect snowpack?

Not at large, no.

Most snowpack is found in places where winter is actually cold. What it does propose is a more nuanced approach to climate-specific forest and watershed management.

Speaking of nuanced approaches to forest management, there is currently growing steam behind proposals to thin the forests in the Sierra Nevada mountains in order to increase California’s water supply. The idea is that “just like crops, trees consume water.” These proposals are getting flak from many angles, with responses asserting that the studies are paid for by logging companies, and others simply excoriating the science involved — which are admitted by the proponents themselves as “back-of-the-envelope calculations.”

Environment Now’s study-in-response-to-this-study refutes the logging proposal for a variety of reasons. These include that the increases in water yield are very modest, that the increases are seasonally based (meaning that increases are limited to already-wet seasons when they are less needed) and that the thinning of the forest only makes room for vegetative regrowth, which would fill the vacuum within five to 10 years and make redundant all the logging performed.

If logging-for-water somehow does get mobilized, it is bad news for the snowpack (because the Sierras do actually get cold). Not only are trees vital anchors for avalanches, their duty in protecting snowpack is crucial to many animals who use snow for shelter from intense wayward freezes. Because snow is an incredible incubator, many species rely on it to survive the winter cold — everything from classic mammal examples, like bears, to insects whose survival is necessary if migratory birds are to have anything to eat come summer time.

Forested areas crucial to snowpack retention across the United States are in dire need of restoration. Beetles and blister rust are decimating forests across the country, putting wildlife from the Grizzly bear to the Pacific Salmon in danger. On top of wildlife, reducing forested areas also increases the chances of catastrophic floods. American Forests is hard at work planting millions of trees in the vital regions.

The post Winter Snow, Your Water and Trees: It’s More Complicated Than You Think appeared first on American Forests.

Black Walnut (Juglans nigra)

American Forests National Tree Register, Species: Black Walnut (Juglans nigra), State: CA
Description

Location Weott, CA

Black WALNUT

Juglans nigra

This champion Black Walnut of California made its debut on the list of American Forests Champion Trees in , as it is the largest known tree of its species in the country. By recognizing these champions, we recognize the beauty and critical ecosystem services provided by our biggest and oldest trees.

jQuery(document).ready(function(){
jQuery(‘.bt_images_slider’).bxSlider({
mode: ‘fade’,
captions: false,
adaptiveHeight: true,
slideWidth: ‘auto’,
preloadImages: ‘all’,
pager: false,
controls: false,
nextSelector: ‘#bt_images_slider’,
auto: false,
speed: 0
});
});

STATUS Champion
Tree circumference 300
height 118
crown spread 115
Total points 447

LOCATION Weott, CA
Nominated by Michael Taylor
Year Nominated 2011
Date crowned

Other Champion Trees

Juglans californica

Platanus racemosa

Picea breweriana

Help us protect ecosystems where Big Trees thrive

Ways to Engage

search-icon

Search

Search the American Forests Champion Tree national register.

Nominate

Nominate a big tree that you think can achieve champion status.

Explore

Browse stories on our blog, Loose Leaf, and get to know the people and champions that make up the program.

Subscribe

Sign up for our big tree email list and receive year-round updates on the program.

The post Black Walnut (Juglans nigra) appeared first on American Forests.

Bluegum Eucalyptus (Eucalyptus globulus)

American Forests National Tree Register, Species: Bluegum Eucalyptus (Eucalyptus globulus), State: CA
Description

Location Petrolia, CA

Bluegum EUCALYPTUS

Eucalyptus globulus

This champion Bluegum Eucalyptus of California made its debut on the list of American Forests Champion Trees in , as it is the largest known tree of its species in the country. By recognizing these champions, we recognize the beauty and critical ecosystem services provided by our biggest and oldest trees.

jQuery(document).ready(function(){
jQuery(‘.bt_images_slider’).bxSlider({
mode: ‘fade’,
captions: false,
adaptiveHeight: true,
slideWidth: ‘auto’,
preloadImages: ‘all’,
pager: false,
controls: false,
nextSelector: ‘#bt_images_slider’,
auto: false,
speed: 0
});
});

STATUS Champion
Tree circumference 586
height 141
crown spread 126
Total points 759

LOCATION Petrolia, CA
Nominated by Loren Salladay, Robert Bush
Year Nominated 2000
Date crowned

Other Champion Trees

Araucaria cunninghamii

Pinus ponderosa var. benthamiana

Quercus douglasii

Help us protect ecosystems where Big Trees thrive

Ways to Engage

search-icon

Search

Search the American Forests Champion Tree national register.

Nominate

Nominate a big tree that you think can achieve champion status.

Explore

Browse stories on our blog, Loose Leaf, and get to know the people and champions that make up the program.

Subscribe

Sign up for our big tree email list and receive year-round updates on the program.

The post Bluegum Eucalyptus (Eucalyptus globulus) appeared first on American Forests.

Bristlecone Fir (Abies bracteata)

American Forests National Tree Register, Species: Bristlecone Fir (Abies bracteata), State: CA
Description It is in good health. One of its neighbors is also large among Bristlecones. I also nominated this tree about two years ago, directly to Art Cowley, but it has never appeared in the register. I am sending a 2006 jpg picture. Art may still have the paper photos that I sent earlier.

Location Monterey, CA

Bristlecone FIR

Abies bracteata

This champion Bristlecone Fir of California made its debut on the list of American Forests Champion Trees in , as it is the largest known tree of its species in the country. By recognizing these champions, we recognize the beauty and critical ecosystem services provided by our biggest and oldest trees.

jQuery(document).ready(function(){
jQuery(‘.bt_images_slider’).bxSlider({
mode: ‘fade’,
captions: false,
adaptiveHeight: true,
slideWidth: ‘auto’,
preloadImages: ‘all’,
pager: false,
controls: false,
nextSelector: ‘#bt_images_slider’,
auto: false,
speed: 0
});
});

STATUS Champion
Tree circumference 150
height 127
crown spread 36
Total points 286

LOCATION Monterey, CA
Nominated by Alan Washburn
Year Nominated 2006
Date crowned

Other Champion Trees

Abies magnifica

Abies concolor var. lowiana

Abies grandis

Help us protect ecosystems where Big Trees thrive

Ways to Engage

search-icon

Search

Search the American Forests Champion Tree national register.

Nominate

Nominate a big tree that you think can achieve champion status.

Explore

Browse stories on our blog, Loose Leaf, and get to know the people and champions that make up the program.

Subscribe

Sign up for our big tree email list and receive year-round updates on the program.

The post Bristlecone Fir (Abies bracteata) appeared first on American Forests.

Common chokecherry Cherry (Prunus virginiana)

American Forests National Tree Register, Species: Common chokecherry Cherry (Prunus virginiana), State: MD
Description Tree is in fair to poor health, has lost some crown. (Mr. Rurka is deceased, Mrs. Rurka wants both names listed)

Location Baltimore, MD

Common chokecherry CHERRY

Prunus virginiana

This champion Common chokecherry Cherry of Maryland made its debut on the list of American Forests Champion Trees in , as it is the largest known tree of its species in the country. By recognizing these champions, we recognize the beauty and critical ecosystem services provided by our biggest and oldest trees.

jQuery(document).ready(function(){
jQuery(‘.bt_images_slider’).bxSlider({
mode: ‘fade’,
captions: false,
adaptiveHeight: true,
slideWidth: ‘auto’,
preloadImages: ‘all’,
pager: true,
controls: false,
nextSelector: ‘#bt_images_slider’,
auto: false,
speed: 0
});
});

STATUS Champion
Tree circumference 196
height 41
crown spread 69
Total points 254

LOCATION Baltimore, MD
Nominated by Francis X. and Wendy L. Rurka
Year Nominated 1999
Date crowned

Other Champion Trees

Morus nigra

Prunus myrtifolia

Prunus alabamensis

Help us protect ecosystems where Big Trees thrive

Ways to Engage

search-icon

Search

Search the American Forests Champion Tree national register.

Nominate

Nominate a big tree that you think can achieve champion status.

Explore

Browse stories on our blog, Loose Leaf, and get to know the people and champions that make up the program.

Subscribe

Sign up for our big tree email list and receive year-round updates on the program.

The post Common chokecherry Cherry (Prunus virginiana) appeared first on American Forests.